Mapped: The World’s Top 50 Science and Technology Hubs

This map explores the world’s top 50 science and technology hubs based on the Global Innovation Index 2023 data. Read more
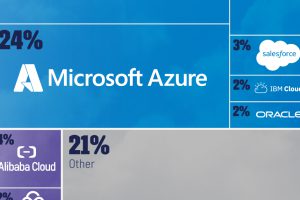
The World’s Biggest Cloud Computing Service Providers

Cloud computing service providers generated $270 billion in revenues last year, concentrated among a few giants. Read more

Visualizing the Biggest Companies on Major Stock Exchanges

With trillion dollar valuations becoming more common, we’ve compared the five biggest companies by stock exchange. Read more

Ranked: The Most Popular Smartphone Brands in the U.S.

This graphic breaks down America’s most preferred smartphone brands, according to a December 2023 consumer survey. Read more
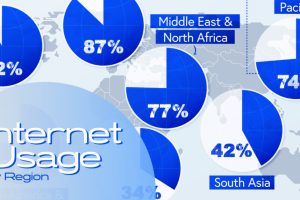
Visualizing Internet Usage by Global Region

In this infographic, we map out internet usage by global region based on the latest data from the World Bank. Read more

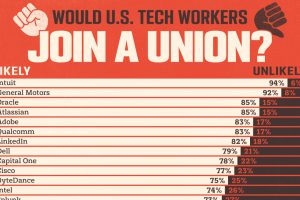
Charted: How American Tech Workers Feel About Joining a Union

The last few years have seen mass layoffs at Google, Amazon, and Tesla. Has this impacted how tech workers feel about unions? Read more

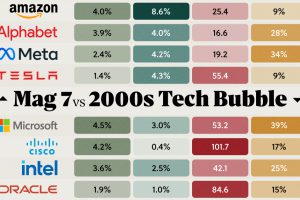
Stock Comparison: Magnificent 7 vs. 2000s Tech Bubble

We visualized key stock metrics to see how the Magnificent 7 compares to seven of the top stocks from the 2000s tech bubble. Read more