The World’s Top 50 Science and Technology Hubs
This was originally posted on our Voronoi app. Download the app for free on iOS or Android and discover incredible data-driven charts from a variety of trusted sources.
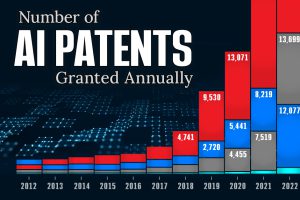
In 2023, the world experienced another wave of science and technology (S&T) innovation, from the introduction of the first over-the-counter birth control pill in the U.S. to the stunning growth of ChatGPT and artificial intelligence.
This map explores the world’s top 50 science and technology hubs leading these innovations based on data from the Global Innovation Index 2023. Hubs were ranked by their combined share of international patent applications and scientific publications.
East Asia Dominance in S&T
The world’s five most significant science and technology hubs are in East Asia.
The top-ranked Tokyo-Yokohama cluster made up just over 10% of all patent applications between 2018-2022.
| Cluster | Country/Economy | Patent Applications | Scientific Publications |
|---|---|---|---|
| Tokyo-Yokohama | 🇯🇵 Japan | 127,418 | 115,020 |
| Shenzhen-Hong Kong-Guangzhou | 🇨🇳/🇭🇰 China/Hong Kong | 113,482 | 153,180 |
| Seoul | 🇰🇷 South Korea | 63,447 | 133,604 |
| Beijing | 🇨🇳 China | 38,067 | 279,485 |
| Shanghai-Suzhou | 🇨🇳 China | 32,924 | 162,635 |
| San Jose-San Francisco | 🇺🇸 U.S. | 47,269 | 58,575 |
| Osaka-Kobe-Kyoto | 🇯🇵 Japan | 38,413 | 51,948 |
| Boston-Cambridge | 🇺🇸 U.S. | 18,184 | 76,378 |
| San Diego | 🇺🇸 U.S. | 23,261 | 20,928 |
| New York City | 🇺🇸 U.S. | 13,838 | 74,849 |
| Nanjing | 🇨🇳 China | 7,143 | 113,488 |
| Paris | 🇫🇷 France | 15,176 | 61,692 |
| Wuhan | 🇨🇳 China | 6,250 | 89,756 |
| Hangzhou | 🇨🇳 China | 10,755 | 62,924 |
| Nagoya | 🇯🇵 Japan | 17,736 | 16,091 |
| Los Angeles, | 🇺🇸 U.S. | 11,556 | 44,058 |
| Washington, DC–Baltimore | 🇺🇸 U.S. | 5,525 | 76,039 |
| Daejeon | 🇰🇷 South Korea | 12,275 | 25,552 |
| Xi’an | 🇨🇳 China | 1,786 | 86,937 |
| London | 🇬🇧 Great Britain | 5,981 | 59,068 |
| Seattle | 🇺🇸 U.S. | 11,472 | 20,322 |
| Munich | 🇩🇪 Germany | 10,248 | 24,239 |
| Qingdao | 🇨🇳 China | 7,286 | 39,745 |
| Chengdu | 🇨🇳 China | 2,046 | 67,334 |
| Cologne | 🇩🇪 Germany | 7,466 | 34,286 |
| Amsterdam–Rotterdam | 🇳🇱 Netherlands | 4,230 | 52,864 |
| Taipei–Hsinchu | 🇹🇼 Taiwan | 3,907 | 52,752 |
| Houston | 🇺🇸 U.S. | 8,475 | 24,636 |
| Stuttgart | 🇩🇪 Germany | 9,342 | 14,874 |
| Tel Aviv–Jerusalem | 🇮🇱 Israel | 7,268 | 24,219 |
| Moscow | 🇷🇺 Russia | 2,036 | 55,086 |
| Chicago | 🇺🇸 U.S. | 5,763 | 32,343 |
| Singapore | 🇸🇬/🇲🇾 Singapore/Malaysia | 4,861 | 36,803 |
| Tehran | 🇮🇷 Iran | 249 | 63,113 |
| Philadelphia | 🇺🇸 U.S. | 5,390 | 32,309 |
| Tianjin | 🇨🇳 China | 1,267 | 53,680 |
| Changsha | 🇨🇳 China | 1,149 | 52,768 |
| Stockholm | 🇸🇪 Sweden | 6,069 | 19,984 |
| Minneapolis | 🇺🇸 U.S. | 6,625 | 15,375 |
| Hefei | 🇨🇳 China | 2,549 | 38,974 |
| Eindhoven | 🇳🇱 Netherlands | 7,982 | 5,339 |
| Melbourne | 🇦🇺 Australia | 2,126 | 40,056 |
| Berlin | 🇩🇪 Germany | 3,624 | 30,464 |
| Chongqing | 🇨🇳 China | 1,651 | 41,412 |
| Frankfurt am Main | 🇩🇪 Germany | 5,410 | 18,590 |
| Sydney | 🇦🇺 Australia | 2,539 | 33,695 |
| Raleigh | 🇺🇸 U.S. | 3,057 | 30,206 |
| Madrid | 🇪🇸 Spain | 1,580 | 38,849 |
| Zürich | 🇨🇭 Switzerland | 3,759 | 24,437 |
| Milan | 🇮🇹 Italy | 2,578 | 31,077 |
The first American cluster on the list, the San Francisco Bay Area, is home to major tech companies such as Adobe, eBay, Google, and PayPal.
Along with Cambridge in the United Kingdom, the San Francisco Bay Area is one of the most S&T-intensive clusters relative to overall population density.
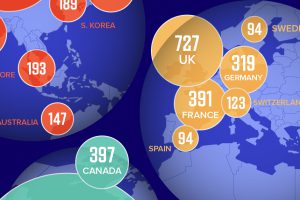
For the first time, China topped the list of countries with the highest number of clusters among the top 100, having 24 total. The United States follows, with 21 clusters, then Germany with nine.
In addition, nearly every Chinese cluster rose in the rankings compared to last year, with only Beijing falling by one place.
São Paulo (Brazil); Bengaluru, Delhi, Chennai, and Mumbai (India); Tehran (Islamic Republic of Iran); Istanbul and Ankara (Türkiye); and Moscow (Russian Federation) are the only middle-income economy clusters outside China.
According to the Global Innovation Index, the U.S. leads in research and development (R&D) expenditure, followed by China, Japan, Germany, and the Republic of Korea.