The Briefing
- Today, the top 1% of U.S. households own 31.2% of total wealth
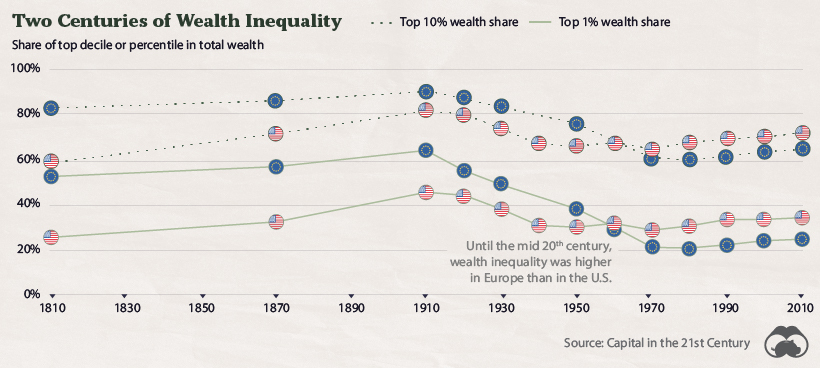
- Data going back over 200 years suggests that wealth inequality in both the U.S. and Europe reached its peak in the early 1900s
What The Data Says About Wealth Inequality
Wealth inequality has gone through peaks and troughs throughout history.
Most recently, in the decade between 2010 and 2020, the top 1% of U.S. households’ portion of wealth has gone from 28.6% to 31.2%.
However, when expressed in raw dollars, things begin to look different. Wealth during the same period for the 1% went from approximately $17.5 trillion to $35 trillion. Meanwhile, the total wealth pool rose from $60 trillion to $112 trillion.
In other words, all households by category have amassed wealth during the same period, albeit at different rates.
| Household Wealth Percentile | Annual Growth in Wealth (CAGR) |
|---|---|
| Top 1% | 6.54% |
| 90-99% | 5.75% |
| 50-90% | 4.97% |
| Bottom 50% | 3.30% |
Source: The Federal Reserve
Drivers Of Wealth Inequality
The longest bull market in history, which went from March 2009 to February 2020, has been a big driver for the recent divergence. The U.S. composition of wealth for the top 1% of households skews towards corporate equities and mutual funds, of which they collectively own $14 trillion. By contrast, the bottom 50% of households own $0.16 trillion.
It’s often said a stock market correction is long overdue. Since the top 1% of households clearly have the most skin in the game, if one were to transpire, wealth inequality would likely retract.
A Longer Term Look
Although the inequality of wealth is heavily discussed in today’s climate, the numbers have been higher before.
Wealth inequality, measured by the top 1% of U.S. households’ portion of wealth, was at its peak at the start of the 20th century. Back then, a harsh and more concrete class divide with lower rates of upward mobility were common themes.

At its peak in 1910, the top 1% of U.S. households owned well over 40% of all wealth. Major world wars and the Great Depression seemed to be catalysts against this, and the years after WWII brought about some of the lowest levels of inequality seen in the modern era.
Wealth inequality has ebbed and flowed throughout history, but it has steadily crept back up in the last few decades. Today, its adverse effects continue to garner the attention of more people—including policy makers who are facing immense pressure to find a solution.
Where does this data come from?
Source: The Fed
Notes: This data covers Q2’2010-Q2’2020


