In a previous post, we looked at the evolution of America’s energy supply, showing how the country’s energy mix has changed from 1776 until today. There were many changes in technology and society over this extended time period, and the changes are quite eye-opening. Wood dominated until steam engine technology developed, and coal took over. Then electricity was discovered, and that gave rise to generating power in all kinds of ways: nuclear, hydro, gas, wind, solar, and more.
While the magnitude of such changes is obvious over centuries, there is even a surprising number of developments just in recent decades.
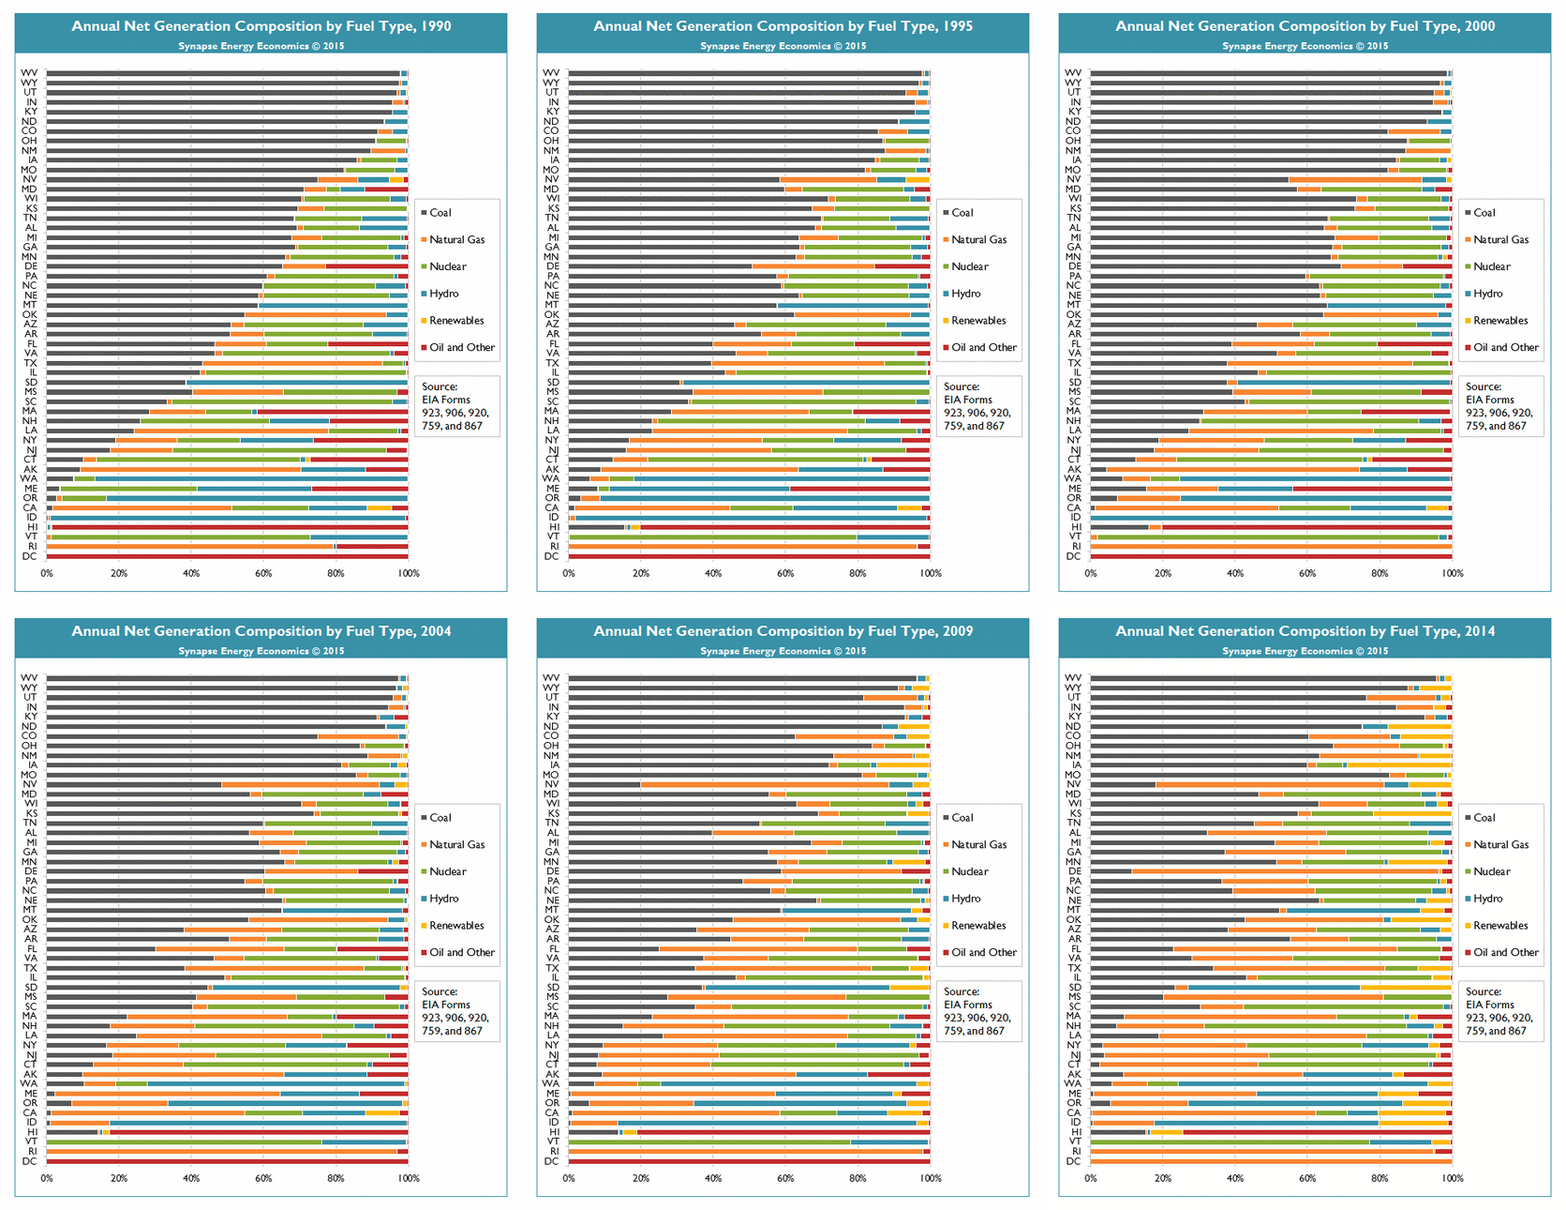
The below animated .gif, which starts with data from 1990, displays the evolution of how electricity is generated in every U.S. state up until 2014.
In this stretch of just 24 years, the way we generate electricity has evolved dramatically:
 Even in 2006, the country got about 50% of its electricity from coal. As we noted in our post that visualized every power plant in the United States, the share that coal now has is closer to 34%.
Why is coal declining? The surge in the use of natural gas and renewables.
Natural gas power now generates 30% of the U.S. electricity, and renewable sources such as solar and wind have grown significantly in the last decade.
In 2005, there were zero states that generated more than 10% of their electricity from renewables. Today, that number is up to 11 states.
Original graphics by: Synapse Energy, RenewEconomy


