War and Peace: How Violence is Disrupting the Global Economy
Although you may not see it, millions of lives are disrupted by violence everyday.
War, homicide, terrorism, suicide, and sexual assault can be found across the world in various degrees. While certain types of violence can incur costs that result in personal traumas, violence can also create significant economic disruptions.
In today’s Chart of the Week, we visualize data estimates from the Global Peace Index 2019 on the global cost of violence, and its geographical spread.
How is Violence Linked to the Economy?
The Global Peace Index calculates the total cost of violence using purchasing power parity (PPP) by considering three factors:
- Direct costs: Immediate consequences to the victims, perpetrators and the government
- Indirect costs: Delayed economic losses following the violent event, including the after-effects of trauma experienced by the victim
- Multiplier effect: Calculates the additional economic activity that would have accrued if the direct costs of violence had been avoided.
Between 2012-2017, the cost of violence increased by 11% to $14.6 trillion—mainly due to rising violence in Syria, Libya, Yemen, and other parts of the Middle East and North Africa.
In 2018, the total cost of violence decreased for the first time in six years to $14.1 trillion. That’s the equivalent of 11.2% of global GDP (PPP), or $1,853 for every person.
In this one year, the $475 billion saved from decreased violence costs was largely due to lower levels of armed conflict in Syria, Ukraine, and Colombia.
The Top 10 Worst Affected Countries
It comes as no surprise that countries affected by conflict incur the greatest costs due to a higher than average death toll, and sizable military expenditures.
Here are the countries with the highest cost of violence according to the report:
| Rank | Country | Cost of violence (% of GDP) | ||||
|---|---|---|---|---|---|---|
| #1 | 🇸🇾 Syria | 67% | ||||
| #2 | 🇦🇫 Afghanistan | 47% | ||||
| #3 | 🇨🇫 Central African Republic | 42% | ||||
| #4 | 🇰🇵 North Korea | 34% | ||||
| #5 | 🇮🇶 Iraq | 32% | ||||
| #6 | 🇻🇪 Venezuela | 30% | ||||
| #7 | 🇨🇾 Cyprus | 30% | ||||
| #8 | 🇸🇴 Somalia | 26% | ||||
| #9 | 🇨🇴 Colombia | 25% | ||||
| #10 | 🇸🇻 El Salvador | 22% |
Since 2017, Venezuela has climbed the ranking and now sits in the top 10, due to continuing political repression and a spiraling economy as a result of hyperinflation.
The Global Composition of Violence
Government spending on military comprises 40% of the global total, or $5.7 trillion in constant purchasing power parity (PPP).
| Type of economic impact | Share of total | |||||
|---|---|---|---|---|---|---|
| Military expenditure | 40.2% | |||||
| Internal security expenditure | 31.7% | |||||
| Homicide | 8.6% | |||||
| Private security expenditure | 5.8% | |||||
| Suicide | 5.2% | |||||
| Armed conflict | 4.8% | |||||
| Violent crime | 2.6% | |||||
| Other | 1% |
Naturally, the types of violence costs vary by region, and the most noticeable difference is in military expenditure. It represents 59% of Middle East and North Africa’s violence costs—but only 8% for Central America and the Caribbean.
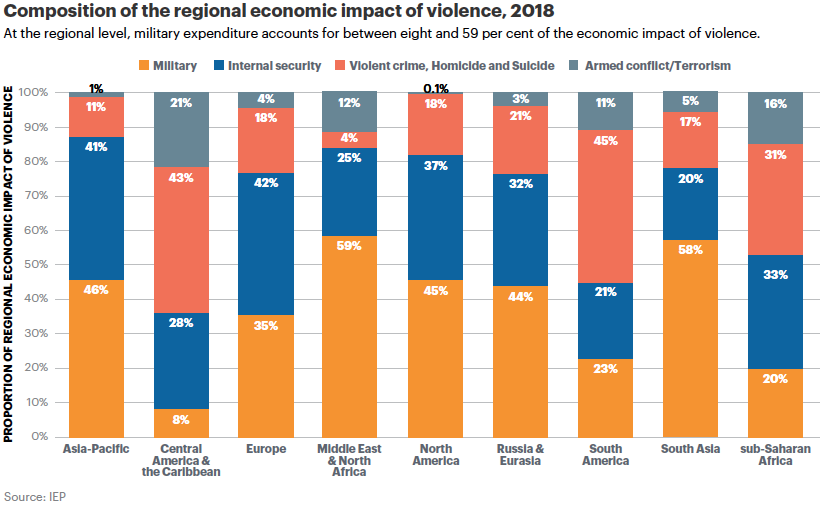
Interestingly, the Middle East and North Africa boast the lowest levels of violent crime, homicide, and suicide, representing only 4% of the total, compared to South America’s 45%.
Keeping the Peace
Despite today’s chart painting a picture of the world as a dangerous place, it is worth noting that there are two sides to this story.
Of the 163 countries ranked in the index, 86 countries improved their peace score in the last year, with Iceland retaining its number one position for over a decade. In fact, the country has not had any gun murders since the Global Peace Index began in 2007.
Is the recent drop in costs of violence a sign that we are moving towards a more peaceful planet, or just a blip on the radar?


