Visualizing the Flow of Oil Around the World
Every day, 93 million barrels of oil are consumed by the world economy.
While a handful of countries are fortunate enough to have sufficient domestic production, many others must go to the $3 trillion global crude market for their energy needs.
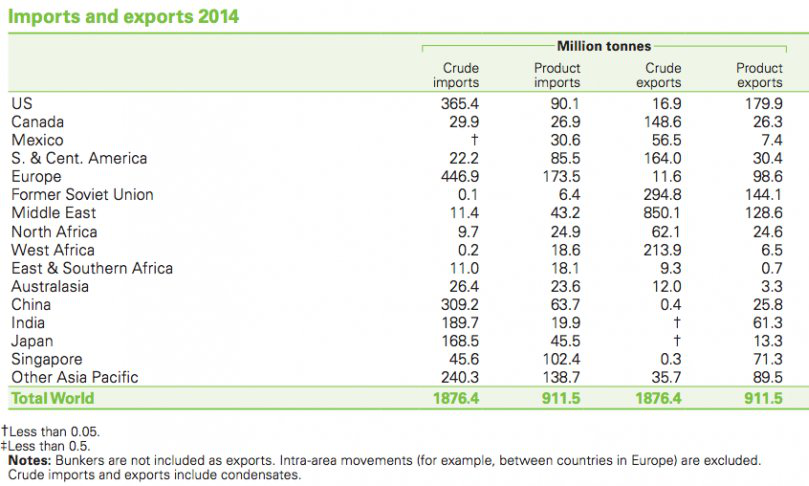
We previously showed how oil prices affect the currencies of net oil importers and exporters, but today’s map and corresponding data from BP looks more specifically at how oil changes hands on the global market.

The Middle East was the biggest exporter of crude oil with 850.1 million tonnes shipped in 2014. Other major exporters include Russia (294.8), West Africa (213.9), and Canada (148.6).
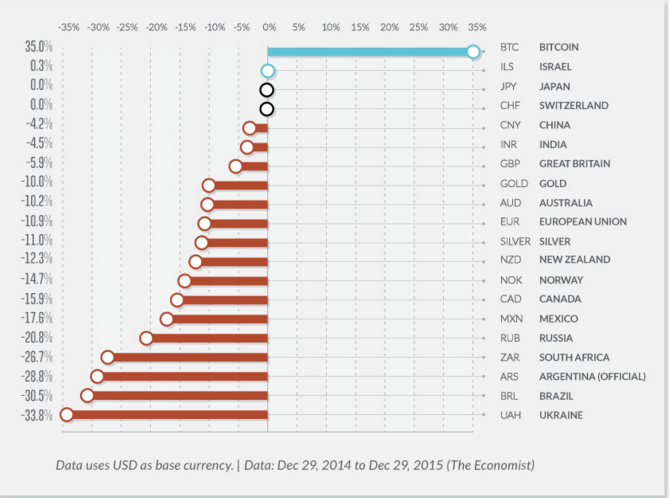
Many countries in this category, such as Canada, are having their currencies hammered to historic lows.
Here is how major currencies did over 2015 – near the bottom of the list, you will see the currencies of many of the significant oil exporters such as Russia, Mexico, Canada, and Norway.

It is also worth noting that Venezuela, another significant exporter, is experiencing hyperinflation right now. However, the country’s tight capital controls mean that inflation information has to be extrapolated from black markets outside the country. DolarToday is a good source for this.


