Visualizing Global Shipping Container Traffic
Globalization owes a lot to the humble shipping container.
In the distant past, loading a ship was a complicated affair involving pallets, crates, and winches. This process was labor-intensive and expensive, meaning most goods were simply not worth shipping overseas.
In the 1970s, the standardized shipping container solved this problem on a wide scale and turned the world economy on its head. This standardization drove the cost of shipping down as the efficiency of ports skyrocketed. Modern ports can now move upwards of 70 containers per crane per hour.
It doesn’t matter anymore where you produce something now, because transport costs aren’t important.
– Rainer Horn, Hapag-Lloyd
Made in China
With the barrier of shipping costs effectively removed, production began to migrate to countries with cheaper production costs.
China is at the center of this new paradigm: nearly one-third of all global containers move through Chinese ports, and seven of the top 10 ports in the world are all located in China.
Countries Moving the Most Units
Here are the 50 countries with the most 20-foot containers passing through their ports:
| Rank | Country | 20-Foot Container Count (2017) |
|---|---|---|
| 1 | China (inc. H.K.) | 234,489,920 |
| 2 | United States | 51,425,464 |
| 3 | Singapore | 33,600,000 |
| 4 | South Korea | 27,427,000 |
| 5 | Malaysia | 24,719,000 |
| 6 | Japan | 21,904,444 |
| 7 | U.A.E. | 21,280,900 |
| 8 | Germany | 19,447,600 |
| 9 | Spain | 17,065,000 |
| 10 | Netherlands | 13,951,000 |
| 11 | Indonesia | 13,859,500 |
| 12 | India | 13,259,000 |
| 13 | Vietnam | 12,284,395 |
| 14 | Belgium | 11,857,009 |
| 15 | Thailand | 10,732,000 |
| 16 | Italy | 10,698,030 |
| 17 | United Kingdom | 10,530,328 |
| 18 | Brazil | 10,049,282 |
| 19 | Turkey | 9,927,385 |
| 20 | Saudi Arabia | 8,404,000 |
| 21 | Philippines | 8,196,961 |
| 22 | Australia | 7,693,643 |
| 23 | Egypt | 7,430,000 |
| 24 | Panama | 6,900,000 |
| 25 | France | 6,714,551 |
| 26 | Mexico | 6,305,000 |
| 27 | Canada | 6,298,590 |
| 28 | Sri Lanka | 6,000,000 |
| 29 | Oman | 4,784,712 |
| 30 | South Africa | 4,634,900 |
| 31 | Morocco | 4,570,000 |
| 32 | Russia | 4,515,000 |
| 33 | Greece | 4,461,000 |
| 34 | Chile | 4,189,669 |
| 35 | Colombia | 3,444,503 |
| 36 | New Zealand | 3,227,100 |
| 37 | Portugal | 3,220,100 |
| 38 | Malta | 3,203,000 |
| 39 | Iran | 3,091,000 |
| 40 | Pakistan | 2,985,600 |
| 41 | Israel | 2,865,028 |
| 42 | Bangladesh | 2,587,000 |
| 43 | Poland | 2,459,900 |
| 44 | Peru | 2,368,989 |
| 45 | Ecuador | 1,944,135 |
| 46 | Finland | 1,920,800 |
| 47 | Argentina | 1,750,102 |
| 48 | Jamaica | 1,689,000 |
| 49 | Nigeria | 1,656,000 |
| 50 | Sweden | 1,593,450 |
Asian countries dominate shipping container traffic, taking up four of the top five spots. Singapore, with a population of just 5.4 million, moved nearly 34 million 20-foot containers in 2017. That’s more than Italy, France, Russia, Sweden, and the U.K. combined.
The United States is still the number two country in the world in terms of the number of containers handled. Two massive ports in Los Angeles control over a quarter of the North American market share, and the Port of New York & New Jersey is the largest on the Eastern Seaboard.
The Stack Keeps Growing
Except for a brief slip in 2009, the number of containers moving through ports has increased every year this millennium so far.
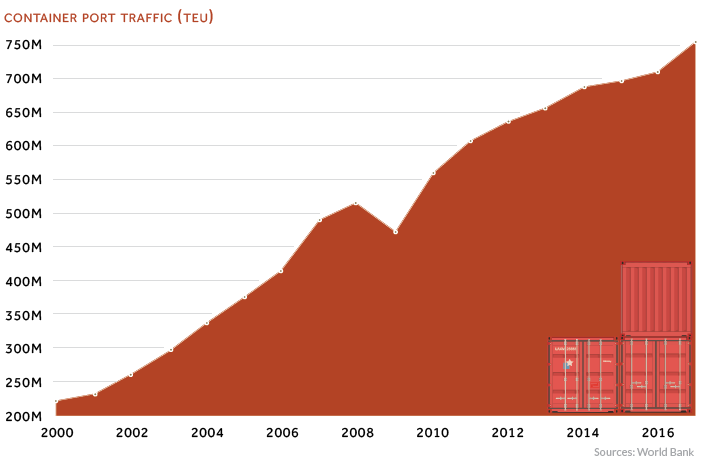
In spite of the recent volley of tariff actions, there appears to be smooth sailing ahead for the growth of containerized shipping.


