Visualizing Data: How the Media Blows Things Out of Proportion
Every year, it seems that there is a new type of virus or an imminent technological disaster that will purportedly threaten the existence of humankind.
If it wasn’t the Y2K apocalypse that would bring society back to the Stone Age, it was going to be the bird flu or cellphone brain tumors that would kill us all.
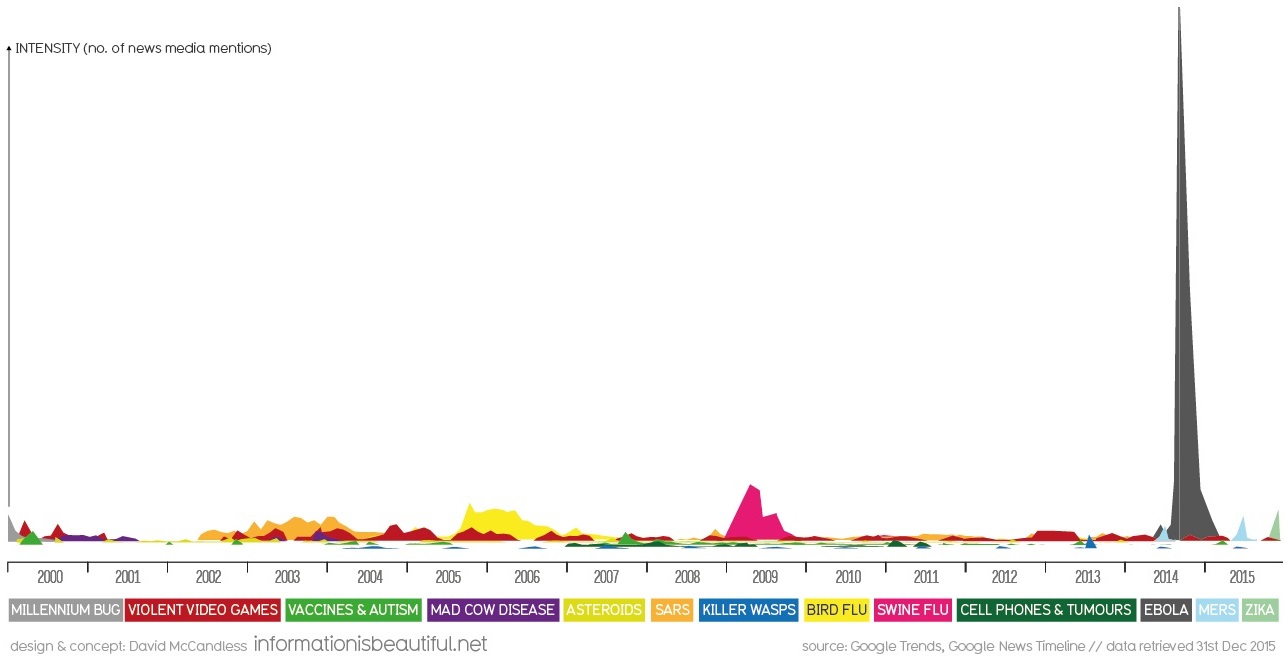
However, as today’s data visualization from Information is Beautiful shows, these fears are mostly overblown. The media finds a way to tap into these hot-button issues and then people inevitably get worked into a frenzy.
“Swine flu”, which broke out in the U.S. in 2009, blew up into a full-on panic by media and authorities. While it did eventually kill about 12,000 people, that’s not very remarkable when it turns out that the common seasonal flu kills between 3,000 to 49,000 people each year, according to the Center for Disease Control.
The public consumed information on the swine flu like there was no tomorrow. Here’s Google searches for “swine flu” surpassing the amount of searches for the newly-elected “Barack Obama”:
But do you know what was even worse than swine flu? Ebola, of course.
In the very first chart on this post, the true length of the data for “ebola” is cut off because the series is literally off the chart. Here’s a revised version that puts all of the data in full perspective:

Based on this level of coverage and interest, the virus must have surely been on the level of the Black Plague, right?
According to The Economist, there were just 28,637 ebola cases and 11,315 deaths worldwide. The World Health Organization officially declared the outbreak to be over in January, and there hasn’t been a trace of the virus since.
Next time the talking heads on television are discussing the newest global distraction, take a deep breath. There’s no need to panic if mountains are being made out of molehills.


