Visualized: Key Events in the COVID-19 Timeline
It’s been a long and eventful year since COVID-19 was officially declared a global pandemic by the World Health Organization (WHO) on March 11, 2020.
The tangible and intangible costs of COVID-19 have been severe. In this visual COVID-19 timeline, we delve into some significant milestones that have occurred around the world.
December 2019-February 2020
Pre-Pandemic COVID-19 Timeline
The origin story actually begins at the turn of the new year, as events began bubbling under the surface in Wuhan, China. The first coronavirus cluster was reported on December 31, 2019, with initial exposures linked to the Huanan Seafood Market.
In the new year, the first coronavirus cases began filtering outside of China, to Thailand and the U.S.—causing the WHO to declare a public health emergency of international concern. As the death toll ticked up to over 200, it was clear that this was no ordinary virus.
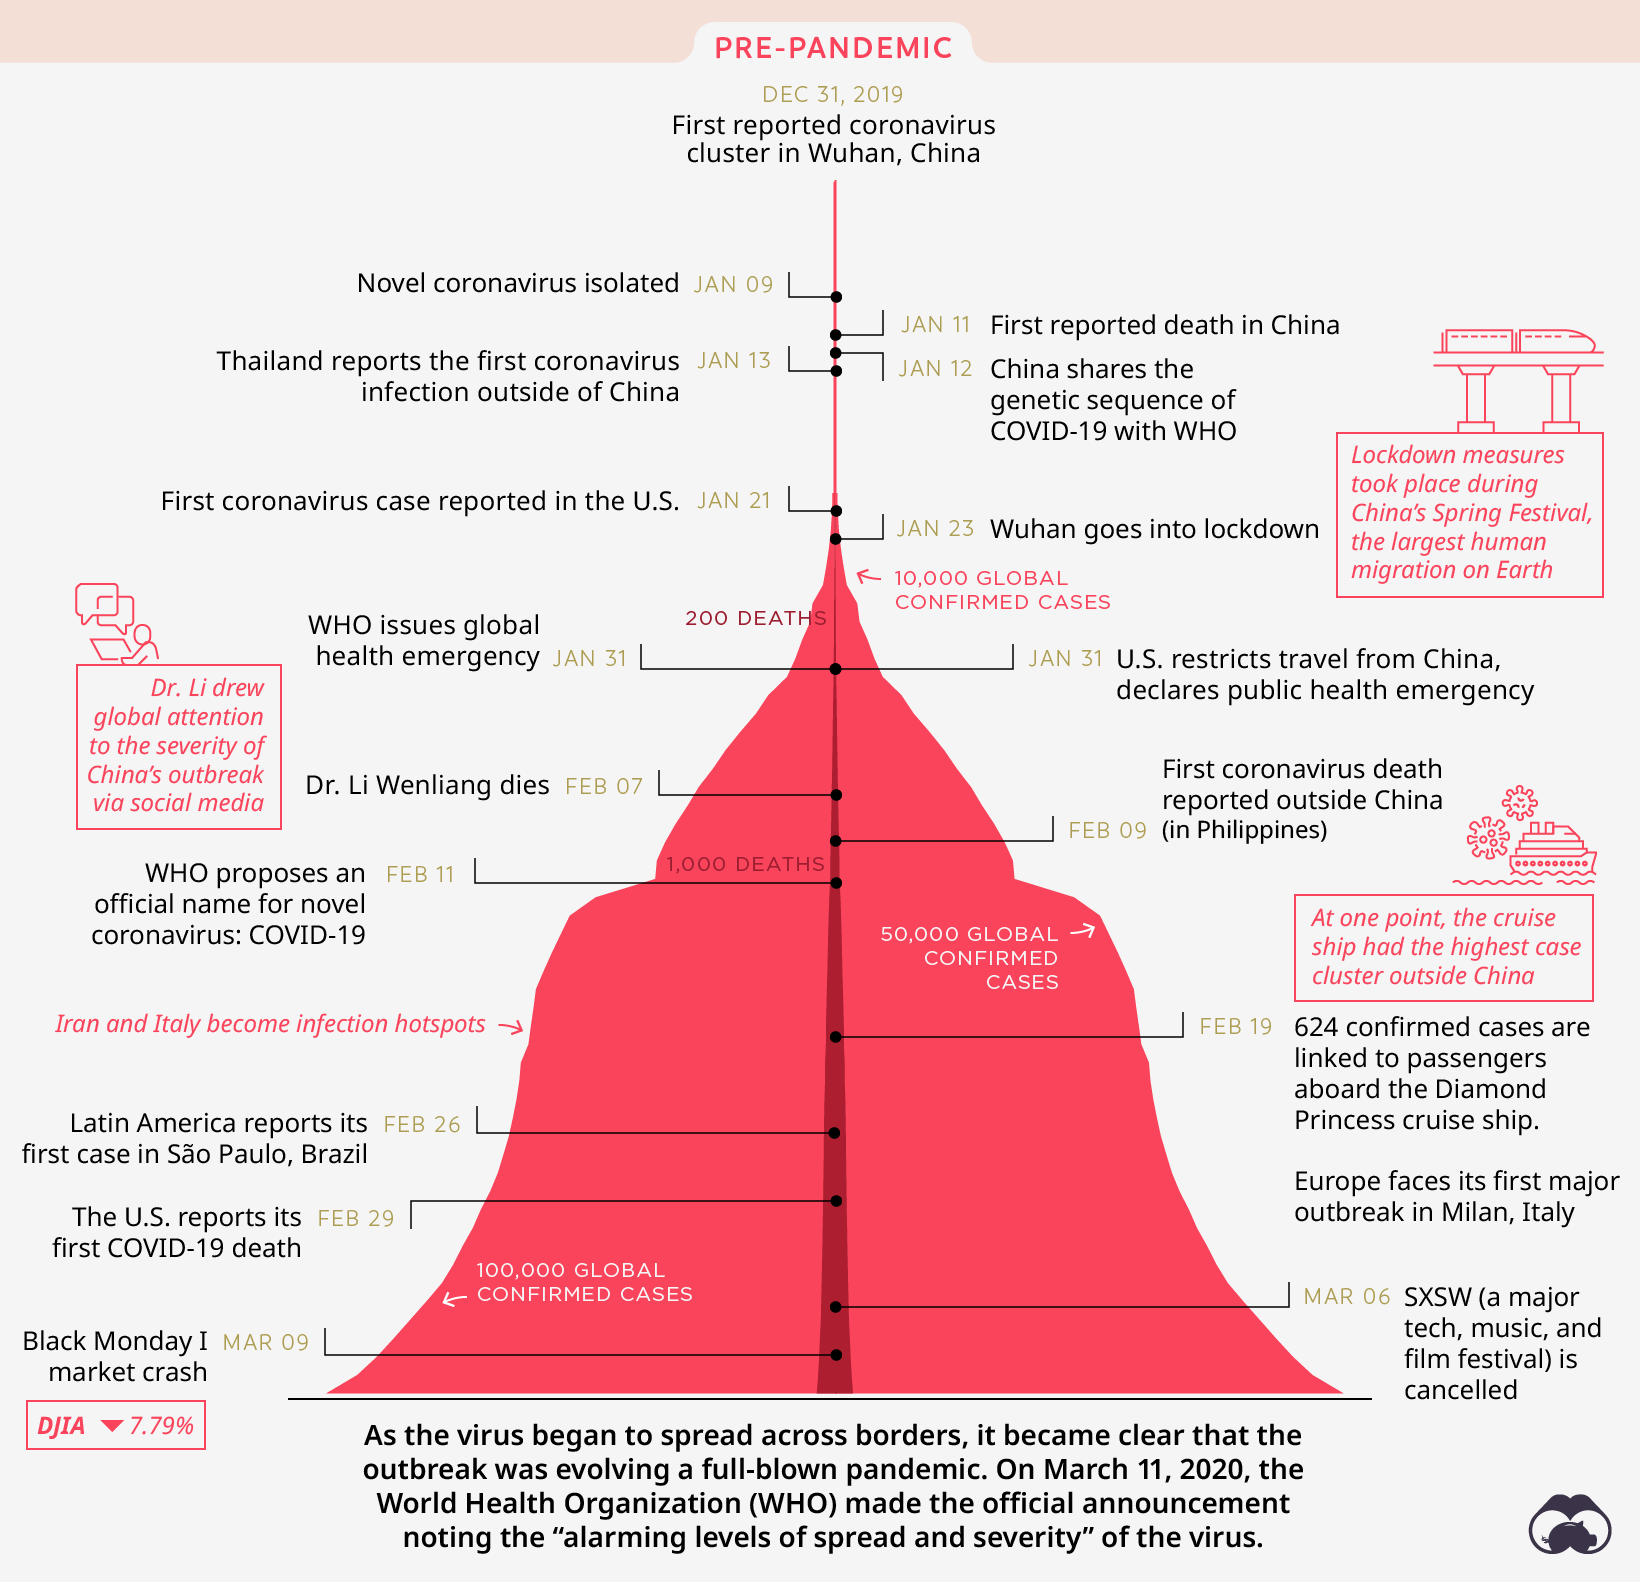
All dates in the graphic are based on when events occurred rather than when they were widely reported.
In February 2020, the novel coronavirus was finally named COVID-19. In addition, the Diamond Princess cruise ship was linked to 624 confirmed cases in late February—the highest case cluster outside of China at the time. The ship captured international headlines when it was refused port in a number of countries, casting COVID-19 into the spotlight.
This month also marked a significant turning point. Dr. Li Wenliang, a Chinese doctor, had tried to draw global attention to the severity of China’s outbreak before he passed of COVID-19 on February 7, 2020.
If the officials had disclosed information about the epidemic earlier I think it would have been a lot better […] There should be more openness and transparency.
—Dr. Li, in a NYT interview a few days before his passing
Italy and Iran then grew significantly as global hotspots of COVID-19. The U.S. reported its first death due to COVID-19—however, it was only discovered in April that there were in fact two prior deaths due to the virus in the country.
On March 11, 2020, WHO made a critical decision. As the virus began to transcend borders and claim thousands of lives, it announced that the COVID-19 outbreak had officially become a deadly global pandemic.
In the year that followed, the virus was relentless in spreading around the world. How have cumulative case counts and death tolls evolved since the beginning?
| Date | Cumulative Cases | Cumulative Deaths |
|---|---|---|
| February 1, 2020 | 12,038 | 259 |
| March 1, 2020 | 88,394 | 2,996 |
| April 1, 2020 | 958,586 | 50,535 |
| May 1, 2020 | 3,368,225 | 242,691 |
| June 1, 2020 | 6,284,173 | 378,365 |
| July 1, 2020 | 10,675,433 | 513,479 |
| August 1, 2020 | 17,852,606 | 681,368 |
| September 1, 2020 | 25,772,515 | 857,960 |
| October 1, 2020 | 34,326,374 | 1,024,204 |
| November 1, 2020 | 46,597,718 | 1,202,376 |
| December 1, 2020 | 64,006,923 | 1,485,018 |
| January 1, 2021 | 84,054,370 | 1,835,383 |
| February 1, 2021 | 103,410,000 | 2,245,069 |
| March 1, 2021 | 114,420,000 | 2,538,582 |
Source: Our World in Data via Johns Hopkins University
Let’s explore key events in the COVID-19 timeline that took place over the course of the past year.
365 Days of the Pandemic
The initial impacts of the pandemic were felt swiftly, and progressively became worse. Within the first three months, the world paid a high human and economic toll.
March-May 2020
Whiplash for the World
Following the WHO announcement, numerous sporting events were cancelled, from the NBA and NHL 2019-2020 seasons to the UEFA Euro men’s soccer championship. Even the Tokyo Summer Olympics were postponed for a year.
In late March 2020, the U.S. surpassed China to become the hardest-hit country by COVID-19. In terms of overall case numbers, it remains the global epicenter of the pandemic today, followed by India and Brazil.
The stock market took a severe hit, with a crash rivaling other recessions and significant financial crises. For example, here’s how the Dow Jones Index Average dropped in March alone:
| Event | Date | Dow Jones Industrial Average (% change) |
|---|---|---|
| Black Monday I | March 9, 2020 | -7.79% |
| Black Thursday | March 12, 2020 | -9.99% |
| Black Monday II | March 16, 2020 | -12.93% |
Stock markets re-entered a bull market in April, but the damage had already been done. The S&P 500, for example, would only return to pre-pandemic levels in August.
The onset of the pandemic led to additional economic chaos. The price of oil flipped negative in April, and over 10 million Americans lost their jobs in the sudden downturn.
To help prop up the economy, the U.S. unveiled the $2 trillion CARES Act, the largest economic stimulus package in history—near 10% of national gross domestic product.
Multiple countries locked down their borders to the rest of the world, from the European Union to India. These travel bans and reduced mobility affected not just airline revenues, but temporarily had a noticeable effect on carbon emissions too.
In addition, two world leaders—UK’s Prime Minister Boris Johnson and Russia’s President Mikhail Mishustin—contracted COVID-19.
June-November 2020
A Deadly Surge
Numbers kept rising over the next six months, following the shifting geography of COVID-19 into densely populated regions such as Africa, South Asia, and the Middle East. In a controversial move, Brazil stopped making its COVID-19 case data public starting June 7, 2020.
Global deaths due to COVID-19 surpassed half a million at the end of June—and jumped to over 1 million by the end of September. Another heartbreaking record was set in mid-October when global cases leapt up by 1 million in just three days.
Former U.S. President Donald Trump, Brazil’s President Jair Bolsonaro, and Poland’s President Andrzej Duda were among many more world leaders to test positive for COVID-19.
December 2020-March 2021
Vaccines Bring Hope
At the very end of 2020, some optimism for things going back to normal was restored when Moderna announced the very first vaccine candidate, followed by Pfizer/BioNTech.
However, more alarm was raised as reports of a faster-spreading, more infectious strain of COVID-19 emerged from the UK. Two more variants have also since been discovered:
| Variant | Date identified | Location | Countries with Reported Cases (Feb 28, 2021) |
|---|---|---|---|
| B.1.1.7 | Sep 2020 | 🇬🇧 United Kingdom | 94 |
| B.1.351 | Oct 2020 | 🇿🇦 South Africa | 48 |
| P.1 | Jan 2021 | 🇧🇷 Brazil* | 25 |
*Note: P.1 was first detected in Japan but traced back to Brazil
In January 2021, WHO organized an international scientific consultation around these variants. The good news? Existing and emerging vaccines will still potentially provide adequate protection against these variants.
In March 2021, the U.S. Congress approved President Biden’s $1.9 trillion pandemic relief bill. Some details of the money breakdown include:
- Up to $1,400-per-person stimulus payments for 90% of households
- $350 billion in state and local aid
- $8.5 billion to rural hospitals and healthcare providers
The rest is expected to go towards safely reopening K-12 schools, assisting hard-hit small businesses, extending food stamp benefits, vaccine R&D and distribution, and more.
An End in Sight for the COVID-19 Timeline?
With the global vaccine rollout now underway, many more key vaccine producers, from AstraZeneca/Oxford University to Johnson & Johnson, have joined in the fight to return life to normal.
Although there have been deep losses due to COVID-19, many hope that we’ll learn from the lessons of this past year, and emerge stronger than ever.
We have come so far, we have suffered so much and we have lost so many. We cannot, we must not squander the progress we have made… Science, solutions and solidarity remain our guide. There are no short-cuts.—Dr. Tedros Adhanom Ghebreyesus, Director-General of WHO
Correction: In a previous version of the graphic, Russian Prime Minister, Mikhail Mishustin, was incorrectly listed as President.


