Is it possible to time the market cycle to capture big gains?
Like many controversial topics in investing, there is no real professional consensus on market timing. Academics claim that it’s not possible, while traders and chartists swear by the idea.
That said, one thing that everyone can probably agree on is that markets are cyclical and that securities do have recurring chart patterns. They aren’t predictable all of the time, but learning the fundamentals around market cycles can only help an investor in furthering their understanding of how things work.
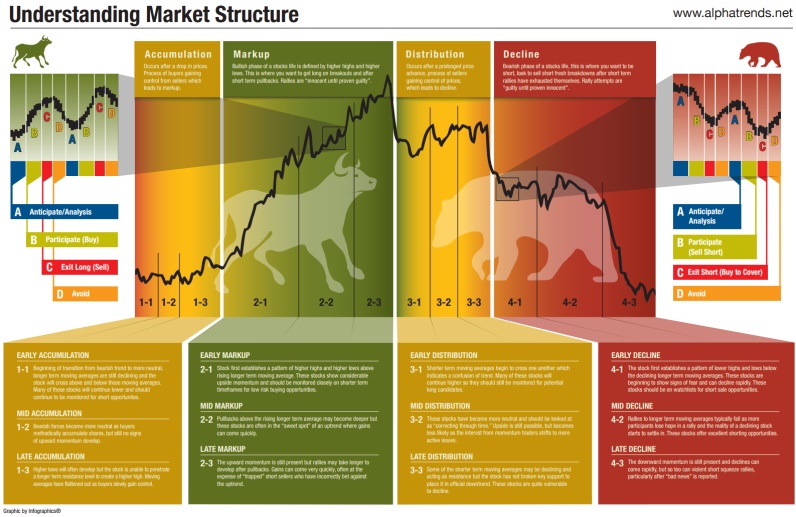
The following infographic explains the four important phases of market trends, based on the methodology of the famous stock market authority Richard Wyckoff. The theory is: the better an investor can identify these phases of the market cycle, the more profits can be made on the ride upwards of a buying opportunity.
See the full size version of this infographic by clicking here.

View full-size version of this graphic.
Here are the descriptions of each major phase of the market cycle:
Accumulation: Occurs after a drop in prices. Process of buyers gaining control from sellers which leads to markup.
Markup: Bullish phase of a stock’s life is defined by higher highs and higher lows. This is where you want to get long on breakouts and after short-term pullbacks. Rallies are “innocent until proven guilty”.
Distribution: Occurs after a prolonged price advance. Sellers gain control of prices, which leads to decline.
Decline: Bearish phase of a stock’s life. This is where you want to be short, so look to sell short fresh breakdowns after minor rallies have exhausted themselves. Rally attempts are “guilty until proven innocent”.
The basic strategy is to pay close attention during the accumulation and distribution phases as the market shifts from buyers to sellers, or vice versa. Then, by recognizing the markup and decline phases, an investor can be appropriately long or short to make solid returns.
Original graphic by: AlphaTrends


