U.S. Unemployment Over Time (1990-2016)
When we are talking about the unemployment rate as a barometer for the health of the economy, it’s most commonly the national figure that gets referenced.
Historically, on a national level, an unemployment rate in the 4-6% range is generally considered “good”, while higher rates that fall within the 8-10% range are “bad”. Higher rates are usually only seen during times of recessions or crisis, when people around the country are struggling to find work.
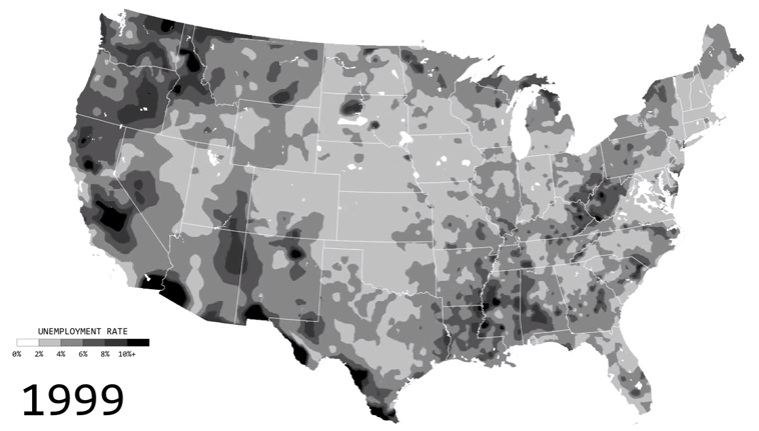
But, as you’ll see in today’s animated map, unemployment rates at the regional level are a very different thing. Today’s map, which comes to us from FlowingData, shows the disparity of unemployment rates in the U.S. based on county estimates, and how they have their own ebbs and flows.
The Impact of a Crisis
The most noticeable element of the animation is the “spread” of unemployment as a crisis hits.
For reference, here’s the map during 1999 – which is around when income peaked for most Americans.

Now here’s a map of the country during the height of the Financial Crisis in 2009. The “spread” of unemployment catches up to people in even the most economically isolated states.

It goes to show that even people in largely rural counties couldn’t stay isolated from a crisis that originated on Wall Street. While it doesn’t affect them immediately, eventually the “creep” of unemployment hits their counties as well.
One interesting exception to note here is North Dakota. With discoveries in the Bakken, and the fracking boom in full flight at the time, the state recorded the lowest rates of unemployment during the crisis.
Today, while the oil boom has slowed because of a lower price environment, it’s true that unemployment is still relatively low at 2.8% in the state.


