It’s no secret that tech giants have exploded in value over the last few years, but the scale can be hard to comprehend.
Through wide-scaling market penetration, smart diversification, and the transformation of products into services, Apple, Microsoft, Amazon, and Google have reached market capitalizations well above $1.5 trillion.
To help us better understand these staggering numbers, a recent study at Mackeeper took the market capitalization of multiple tech giants and compared them with the annual Gross Domestic Product (GDP) of countries.
Editor’s note: While these numbers are interesting to compare, it’s worth noting that they represent different things. Market cap is the total value of shares outstanding in a publicly-traded company and gives an indication of total valuation, and GDP measures the value of all goods and services produced by a country in an entire year.
Companies vs. Countries: Tech Giants
a.bg-showmore-plg-link:hover,a.bg-showmore-plg-link:active,a.bg-showmore-plg-link:focus{color:#0071bb;}
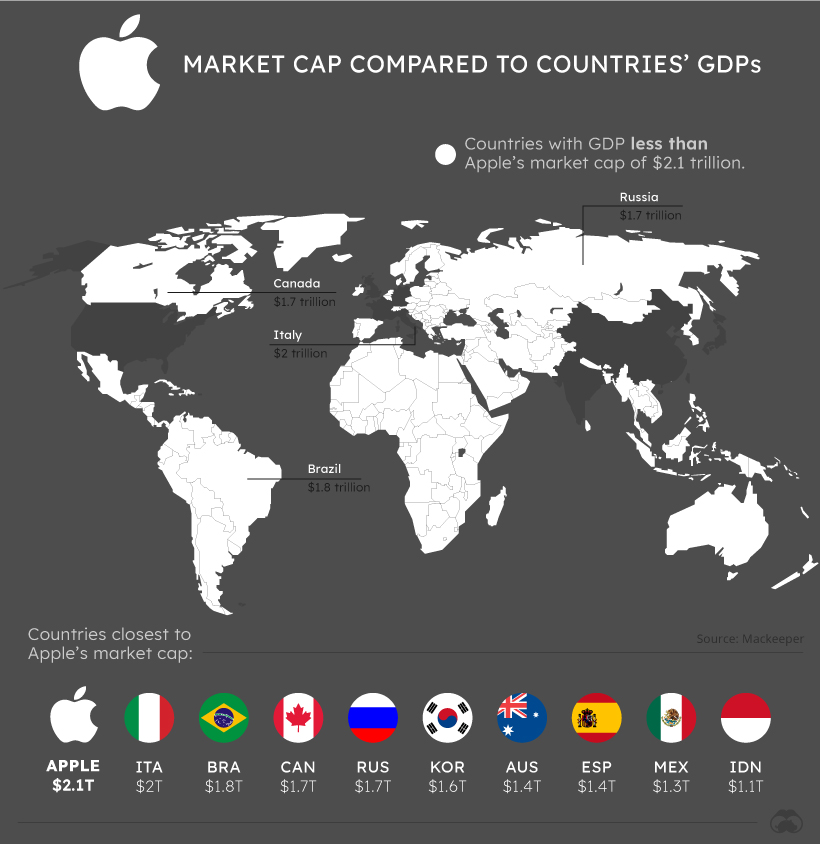
If Apple’s market capitalization was equal to a country’s annual GDP, it might just be in the G7.
At a market cap of more than $2.1 trillion, Apple’s market capitalization is larger than 96% of country GDPs, a list that includes Italy, Brazil, Canada, and Russia.
In fact, only seven countries in the world have a higher GDP than Apple’s market cap.

Further back is Microsoft, which would be the 10th richest country in the world if market cap was equivalent to GDP.
With a market cap of more than $1.9 trillion, Microsoft’s value is larger than the GDP of global powerhouses Brazil, Canada, Russia, and South Korea.

Though all of the tech giants fared well during the COVID-19 pandemic, perhaps none have stood to benefit as much as Amazon.
With online retail and web services both in high demand, Amazon’s market cap has grown to $1.7 trillion, larger than 92% of country GDPs.
Other Companies “Bigger” Than Countries
Tech giants aren’t the only companies that would give countries a run for their money.
| Country/Company | Nominal GDP (country) or Market Cap (company) |
|---|---|
| United States of America | $21,433 B |
| China | $14,343 B |
| Japan | $5,082 B |
| Germany | $3,861 B |
| India | $2,869 B |
| United Kingdom | $2,829 B |
| France | $2,716 B |
| Apple | $2,125 B |
| Italy | $2,004 B |
| Microsoft | $1,942 B |
| Saudi Aramco | $1,888 B |
| Brazil | $1,840 B |
| Canada | $1,736 B |
| Russia | $1700 B |
| Amazon | $1,688 B |
| Alphabet | $1,656 B |
| South Korea | $1,647 B |
| Australia | $1,397 B |
| Spain | $1,393 B |
| Mexico | $1,269 B |
| Indonesia | $1,119 B |
| $939 B | |
| Netherlands | $907 B |
| Saudi Arabia | $793 B |
| Turkey | $761 B |
| Tencent | $736 B |
| Switzerland | $703 B |
| Poland | $596 B |
Market cap data as of June 13, 2021
Saudi Arabia’s state-owned corporation Saudi Aramco also makes the list, boasting a market cap more than double the GDP of its home country.
China’s tech giant Tencent also has a market cap that towers over many country GDPs, such as those of Switzerland or Poland.
Until recently, Tencent was also ahead of fellow tech giant Facebook in market cap, but the social network has climbed ahead and almost reached $1 trillion in market capitalization.

Of course, the biggest caveat to consider with these comparisons is the difference between market cap and GDP numbers.
A company’s market cap is a proxy of its net worth in the eyes of public markets and changes constantly, while GDP measures the economic output of a country in a given year.
But companies directly and indirectly affect the economies of countries around the world. With international reach, wealth accumulation, and impact, it’s important to consider just how much wealth and power these companies have.


