Across the board, beer consumption in the United States has been slowly and steadily dropping since the early ’80s.
However, that fact doesn’t tell the whole story. Trends around beer consumption are anything but uniform, and the industry is evolving rapidly thanks to the craft beer boom in cities throughout the country.
Beer Consumption by State
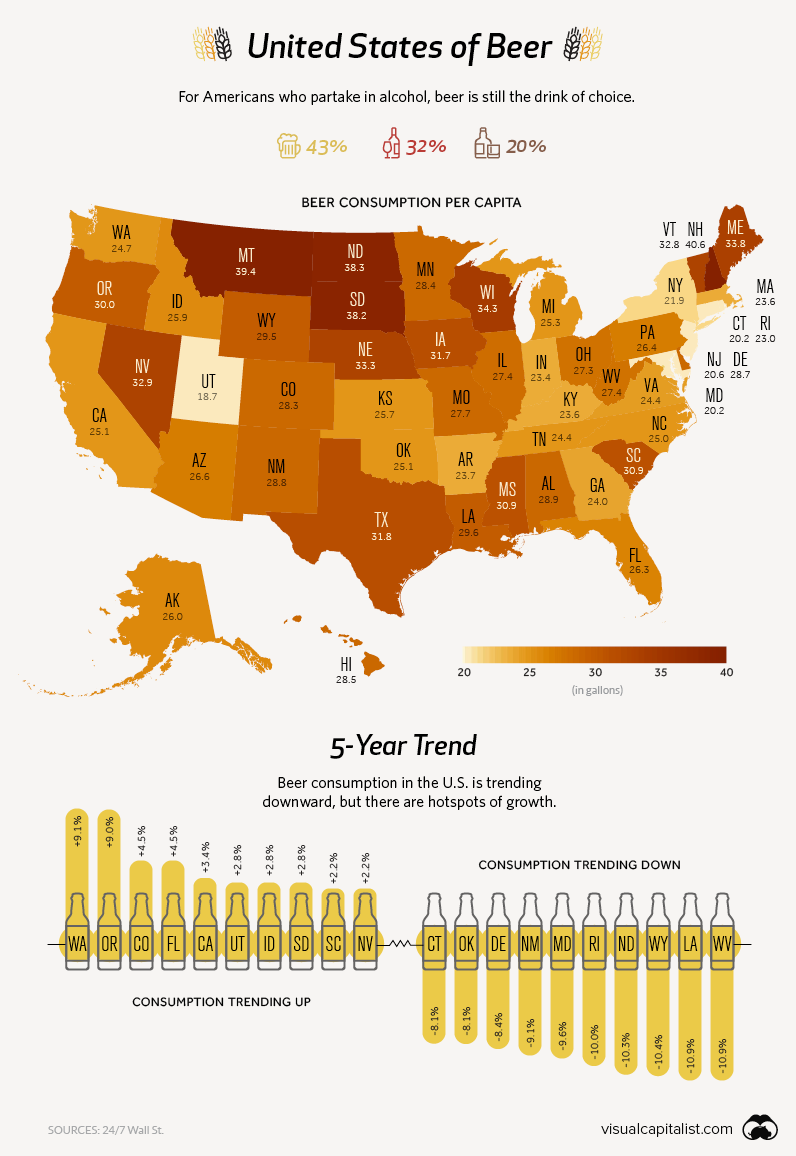
Today’s infographic looks at regional beer consumption, as well as trends over the past half-decade.

Pints of Interest
Beer is still the most popular alcoholic beverage in America, though that demand is not spread equally. Here are states and regions that stand out:
Utah
The Beehive State has unusually low levels of beer consumption for a couple of reasons. First, the state has a high population of Mormons (~60%), who mostly abstain from drinking alcohol. Secondly, Salt Lake City has unusual liquor laws that restrict the percentage of alcohol in beer to 4.0% ABV.
Despite these barriers, Utah’s beer consumption grew by 2.8% between 2012 and 2017 – the sixth highest growth rate in the country.
New Hampshire
Another outlier, though in the opposite direction, is New Hampshire. The state has no sales tax, a fact that beer drinkers in Vermont, Massachusetts, and Maine are well aware of. It’s estimated that over 50% of the states alcohol sales are to out-of-state visitors. NH’s tax-free booze is such a big draw, that bootlegging has become a problem for states like New York.
Pacific Northwest
America’s West Coast – Oregon in particular – has been at the forefront of the craft beer revolution sweeping the country. Portland alone has over 100 craft brewers, and nearly double-digit growth in the past five years. In states like Oregon and Washington, demand shows no sign of slowing down.
The Full List
Here’s a complete table, that sums up beer consumption across the country, as per data from Wall St 24/7.
(Note: It’s currently sorted by % change over the last half-decade)
| State | Per Capita Consumption (Gallons) | Total Consumption (Millions of Gallons) | Change (’12–’17) |
|---|---|---|---|
| Washington | 24.7 | 135.6 | 9.1% |
| Oregon | 30.0 | 95.4 | 9.0% |
| Colorado | 28.3 | 117.6 | 4.5% |
| Florida | 26.3 | 423.1 | 4.5% |
| California | 25.1 | 724.9 | 3.4% |
| Idaho | 25.9 | 31.5 | 2.8% |
| South Dakota | 38.2 | 23.7 | 2.8% |
| Utah | 18.7 | 38.1 | 2.8% |
| Nevada | 32.9 | 72.9 | 2.2% |
| South Carolina | 30.9 | 115.0 | 2.2% |
| Montana | 39.4 | 30.8 | 1.4% |
| Texas | 31.8 | 626.3 | 1.3% |
| Maine | 33.8 | 34.9 | 0.2% |
| Georgia | 24.0 | 179.6 | 0.1% |
| Minnesota | 28.4 | 115.4 | 0.1% |
| Kentucky | 23.6 | 77.1 | -0.8% |
| North Carolina | 25.0 | 188.0 | -1.1% |
| Arizona | 26.6 | 135.6 | -1.4% |
| Tennessee | 24.4 | 120.8 | -1.6% |
| Nebraska | 33.3 | 45.3 | -1.7% |
| Alabama | 28.9 | 103.7 | -2.3% |
| Wisconsin | 34.3 | 147.1 | -2.4% |
| Hawaii | 28.5 | 30.6 | -2.9% |
| New York | 21.9 | 327.5 | -2.9% |
| New Hampshire | 40.6 | 41.8 | -3.5% |
| New Jersey | 20.6 | 138.0 | -3.5% |
| Virginia | 24.4 | 152.7 | -3.6% |
| Michigan | 25.3 | 186.7 | -3.8% |
| Illinois | 27.4 | 259.4 | -3.9% |
| Iowa | 31.7 | 72.0 | -4.0% |
| Alaska | 26.0 | 14.0 | -5.1% |
| Massachusetts | 23.6 | 121.9 | -5.7% |
| Vermont | 32.8 | 15.6 | -5.8% |
| Indiana | 23.4 | 112.7 | -6.0% |
| Pennsylvania | 26.4 | 254.1 | -6.5% |
| Mississippi | 30.9 | 66.6 | -6.7% |
| Arkansas | 23.7 | 52.0 | -6.8% |
| Ohio | 27.3 | 234.7 | -6.9% |
| Missouri | 27.7 | 125.6 | -7.2% |
| Kansas | 25.7 | 53.2 | -7.9% |
| Connecticut | 20.2 | 54.2 | -8.1% |
| Oklahoma | 25.1 | 70.7 | -8.1% |
| Delaware | 28.7 | 20.7 | -8.4% |
| New Mexico | 28.8 | 43.8 | -9.1% |
| Maryland | 20.2 | 90.1 | -9.6% |
| Rhode Island | 23.0 | 18.4 | -10.0% |
| North Dakota | 38.3 | 20.9 | -10.3% |
| Wyoming | 29.5 | 12.3 | -10.4% |
| Louisiana | 29.6 | 99.4 | -10.9% |
| West Virginia | 27.4 | 37.8 | -10.9% |


