Contrarian investors pride themselves in running a different direction than the majority of the pack. They find opportunities in asset classes that are universally hated by the masses, and try to carve out their own convictions by downplaying popular sentiment.
However, at the end of the day, contrarians will concede that it is nice to know how the investing masses are doing.
That’s why the data provided by Openfolio is so beautiful – it combines investing with the openness and connecting nature of social networks. Through this process, the collective portfolios of 50,000 investors can be analyzed and broken down by specific variables to bring out unique insight.
Here’s a few insights from 2015 that come from their data:
1. The average investor in the U.S. was down 3.09%.
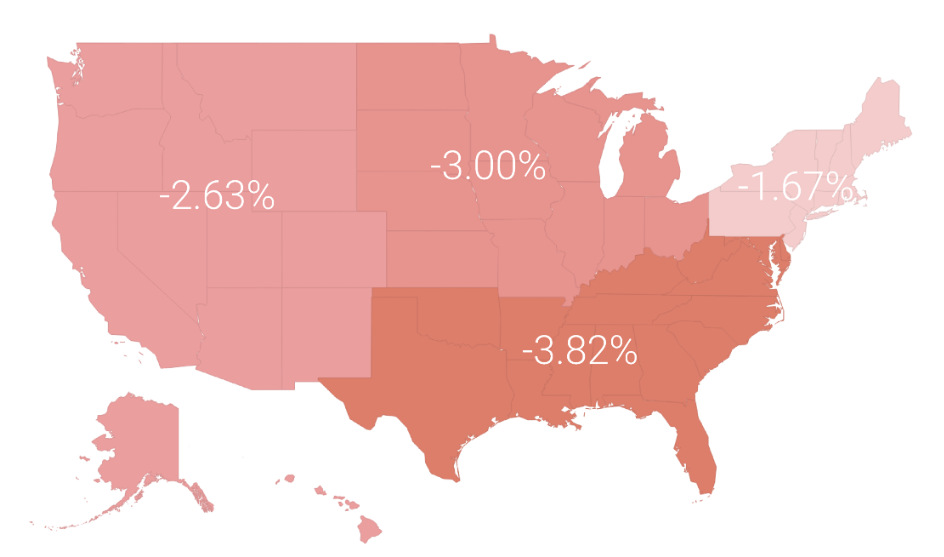
Here’s the breakdown of performance by region:

About one-third of total investors made money on the year, while two-thirds lost money on the year. Regionally, the Southeast did the poorest over 2015, mainly because of an overexposure to energy in their portfolios.
So far, the average investor is already down 5.1% in 2016 YTD:

2. Older investors did better in 2015.

In a risky and volatile year, it is no surprise to see that more conservative and experienced investors did better. Openfolio’s insight here is that younger investors tend to concentrate more on individual stocks, and lack portfolio diversification.
3. Teachers had the best-performing portfolios.

Energy professionals particularly suffered, likely because of overexposure to the oil patch in their investment portfolios.


