The 10 Most Populous U.S. Cities, Every Decade Since 1790
View the high resolution version of today’s infographic by clicking here
There are only two cities that have had the distinction of being named the most populous city in the United States.
The first city to hold the title was Philadelphia, as the City of Brotherly Love was estimated to be the biggest city in the country at the time of the signing of the Declaration of Independence.
However, by the time of the first U.S. Census in 1790, New York City had surpassed Philadelphia by a few thousand residents – and the Big Apple has stayed the largest in the country ever since.
From Then to Now
Today’s infographic comes to us from Liberty Cruise, and it ranks the 10 most populous cities in the United States for every decade since 1790.
To start, let’s take a look at what the list looked just after the first U.S. Census in 1790:
| Rank | City | Population (1790) |
|---|---|---|
| #1 | New York City, NY | 33,131 |
| #2 | Philadelphia, PA | 28,522 |
| #3 | Boston, MA | 18,320 |
| #4 | Charleston, SC | 16,359 |
| #5 | Baltimore, MD | 13,503 |
| #6 | Northern Liberties Township, PA | 9,913 |
| #7 | Salem, MA | 7,921 |
| #8 | Newport, RI | 6,716 |
| #9 | Providence, RI | 6,380 |
| #10 | Marblehead, MA | 5,661 |
It’s pretty surreal to think that some of the biggest cities in the late 18th century hosted no more than 6,000 residents.
It also may be a surprise to many that Rhode Island – a state that ranks 50th in size and 44th in population today – held two of the largest towns in the nation at the time: Newport and Providence.
The Modern List
Jump forward over 200 years, and New York City has not lost its top spot.
It helped that NYC was able to absorb Brooklyn – one of the country’s other largest cities – into its boundaries in 1898. Other major cities saw similar merges happen over the years, with Philadelphia absorbing Northern Liberties Township, for example.
Here is a list of the most populous U.S. cities in 2017 (est.):
| Rank | City | Population (Est. 2017) | Population (2010 Census) | Change |
|---|---|---|---|---|
| #1 | New York City, NY | 8,622,698 | 8,175,133 | +5.47% |
| #2 | Los Angeles, CA | 3,999,759 | 3,792,621 | +5.46% |
| #3 | Chicago, IL | 2,716,450 | 2,695,598 | +0.77% |
| #4 | Houston, TX | 2,312,717 | 2,100,263 | +10.12% |
| #5 | Phoenix, AZ | 1,626,078 | 1,445,632 | +12.48% |
| #6 | Philadelphia, PA | 1,580,863 | 1,526,006 | +3.59% |
| #7 | San Antonio, TX | 1,511,946 | 1,327,407 | +13.90% |
| #8 | San Diego, CA | 1,419,516 | 1,307,402 | +8.58% |
| #9 | Dallas TX | 1,341,075 | 1,197,816 | +11.96% |
| #10 | San Jose, CA | 1,035,317 | 945,942 | +9.45% |
In contrast to the NYC of today, the 1790 population looks more like a Long Island suburb.
This rapid urbanization is mainly thanks to Industrial Revolution, which triggered a massive migration to cities, allowing New York to grow 26,000% in total population.
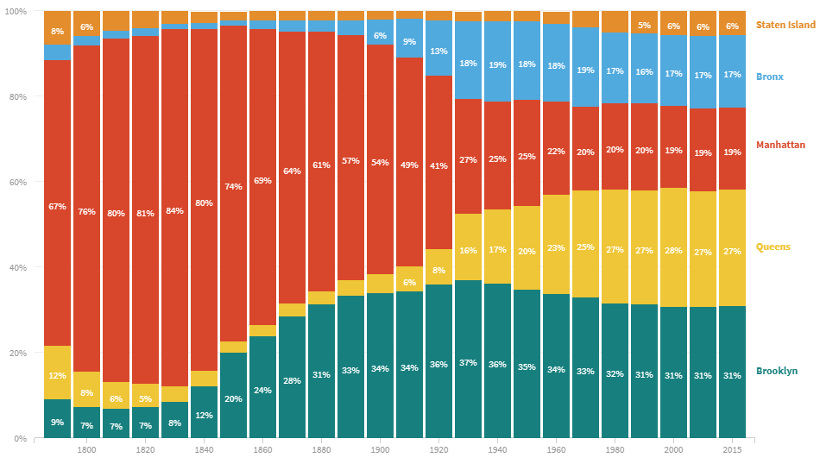
Here’s how the population distribution of New York City’s five boroughs has changed over time:

Interested in learning more about the country’s largest cities?
See the electrifying pulse of a Manhattan workday or view a 3d map that shows how much U.S. metro areas contribute to economic growth.


