

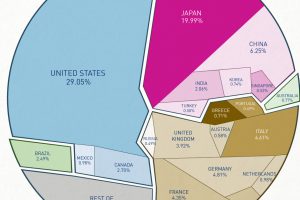
This data visualization shows total world debt by country and debt-to-GDP ratio. Read more
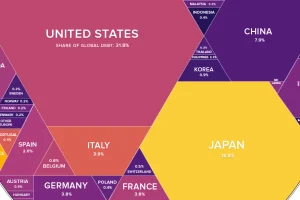
How much debt has been racked up by governments? This stunning infographic shows each country’s share of world debt, along with their debt-to-GDP ratio. Read more
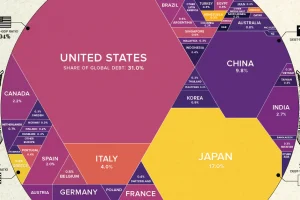
What share of government world debt does each country owe? See it all broken down in this stunning visualization. Read more
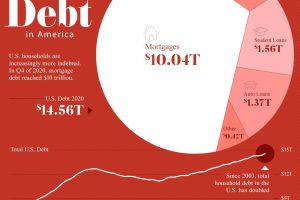
Since 2003, U.S. household debt has doubled to over $14.5 trillion. We break down the components of this colossal figure. Read more
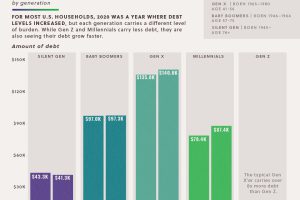
The majority of U.S. households saw debts rise in 2020. This data looks at the growth in household debt and the existing debt pile, by generation Read more

Global debt reached $226T by the end of 2020 – the biggest one-year jump since WWII. This graphic compares the debt-to-GDP ratio of various countries. Read more

Global debt has soared since the pandemic. Which countries have the biggest stockpile of debt outstanding in 2023? Read more