

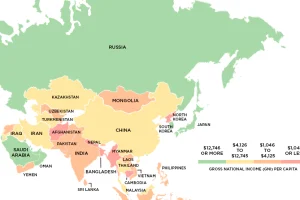
This series of maps uses data on Gross National Income (GNI) to classify the world’s richest and poorest countries based on four income groups. Read more
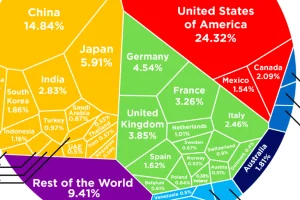
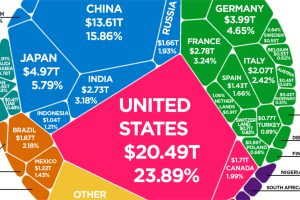
See how the multi-trillion dollar pie of the global economy gets divided between countries, based on the latest data from the World Bank from February 2017. Read more
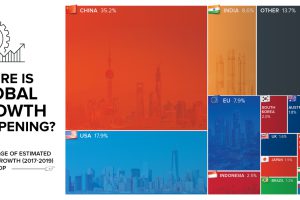
By 2019, the global economy is projected to expand another $6.5 trillion. Today’s chart shows which countries will help to fuel this global growth. Read more
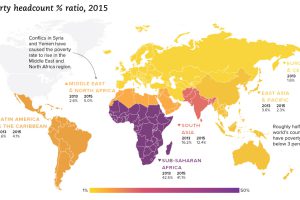
We look at the latest data from the World Bank, which reveals a drop in extreme poverty of 1 billion people globally since the year 1990. Read more
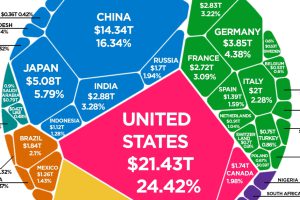
According to the latest World Bank data, the global economy is now $85.8 trillion in nominal terms. Here’s how it breaks down. Read more
The world’s total GDP crested $88 trillion in 2019—but how are the current COVID-19 economic contractions affecting its future outlook? Read more
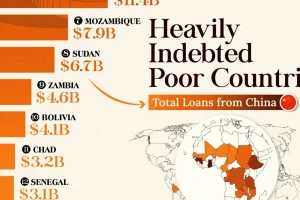
This infographic lists countries in Africa and other developing regions that received billions in loans from China. Read more