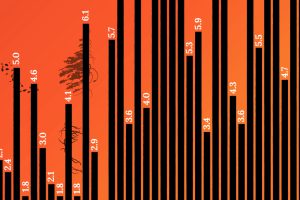
While the number of U.S. wildfires has fallen in recent years, the total land burned has increased, pointing to the growing intensity and severity of these fires. Read more
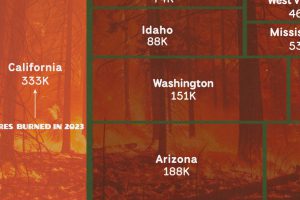
Just five states account for nearly half of all wildfire area burned in 2023. Read more
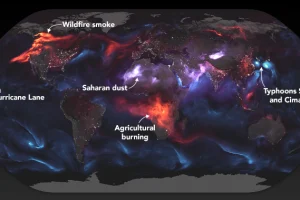
These stunning images from NASA give a whole new perspective on the massive wildfires engulfing the west coast of North America. Read more
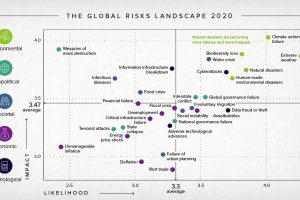
The Global Risk Report 2020 paints an unprecedented risk landscape for 2020—one dominated by climate change and other environmental concerns. Read more

From wildfire smoke molecules to the coronavirus, this graphic compares the relative size of particles that we, for the most part, can’t see. Read more
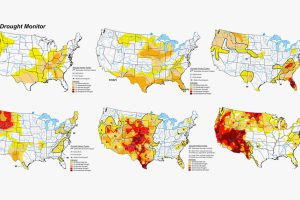
The Western U.S. is no stranger to droughts. But this year’s is one of the worst yet. Here’s a historical look at U.S. droughts since 1999. Read more

Here’s a look at the number of wildfires in America that have occurred each year since 1990, and the acres of forest land scorched during that period. Read more
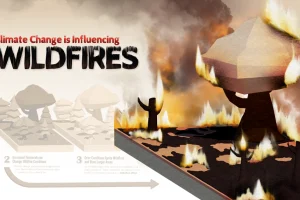
More carbon in the atmosphere is creating a hotter world—and gradually fueling both climate change and instances of wildfires. Read more
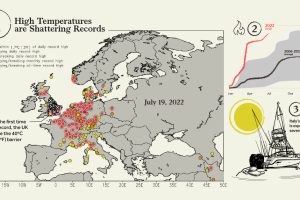
Smoldering temperatures are wreaking havoc across Europe. Here are 5 key things you should know about Europe’s current heatwave. Read more
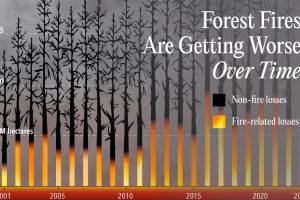
See how total forest cover lost has changed over the last 22 years, along with what portion comes from wildfire impact. Read more

