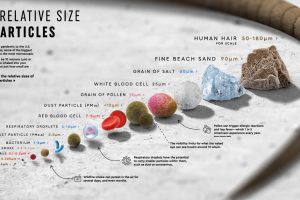
From wildfire smoke molecules to the coronavirus, this graphic compares the relative size of particles that we, for the most part, can’t see. Read more

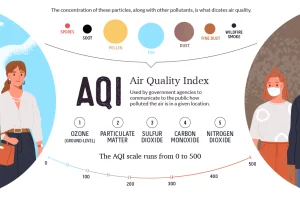
This graphic breaks down how the air quality index is measured, and looks at which regions are hardest hit by atmospheric pollution and wildfires. Read more

