

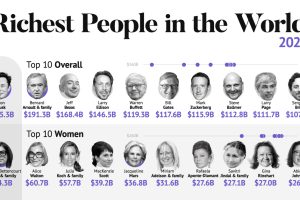
The world’s five richest people are worth a combined $871 billion. From luxury moguls to Asia’s rising titans, we show the richest in 2023. Read more
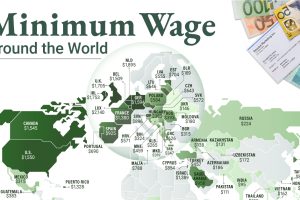
This infographic shows the net minimum wage across 67 countries, as of January 2023. A breakdown by U.S. state is also included. Read more
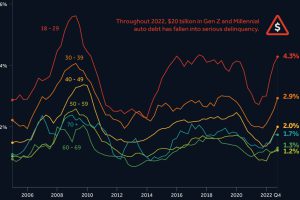
After a borrowing spree during COVID-19, younger Americans are struggling to keep up with their auto loan payments. Read more
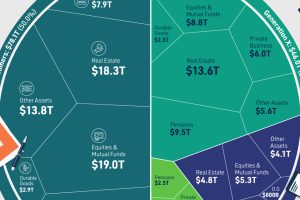
We’ve visualized data from the Federal Reserve to provide a comprehensive break down of U.S. assets by generation. Read more
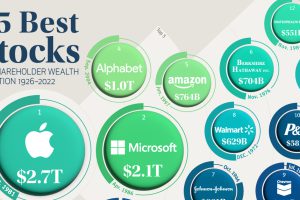
Accounting for just 0.1% of all public U.S. stocks, these companies have created nearly a third of all shareholder wealth since 1926. Read more
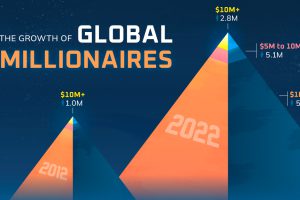
The world’s millionaire population has more than doubled in the last decade between 2012 and 2022. We visualize these numbers here. Read more

In this graphic, we visualize the destinations that saw the biggest influx of seasonal centi-millionaire residents in 2022. Read more
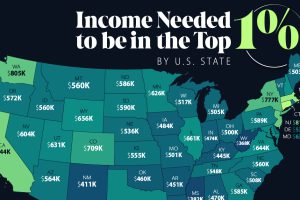
An annual income anywhere between $360,000-$950,000 can grant entry into the top 1%—depending on where you live in America. Read more
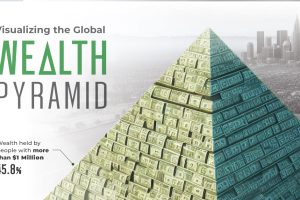
Global wealth stands at over $454 trillion. This graphic shows how it’s distributed, by various levels of net worth. Read more
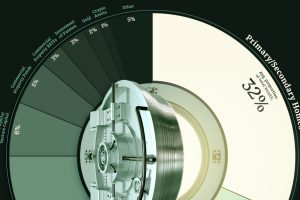
This graphic shows how the ultra-wealthy invest their fortunes, from real estate and equities to luxury items. Read more