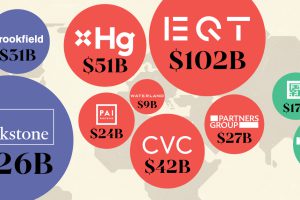
This map visualizes the leading private equity firms of major countries, ranked by capital raised over the past five years. Read more

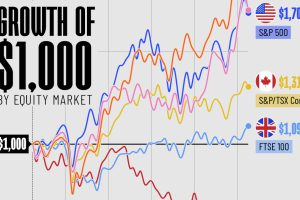
In this graphic, we’ve visualized stock market growth by country over the past five years using major indices. Read more

Tax burden measures the percent of an individual’s income that is paid towards taxes. See where it’s the highest by state in this graphic. Read more

While the U.S. is a major market for cryptocurrencies, two countries surpass it in terms of their rates of crypto ownership. Read more

We visualized the latest data on Berkshire Hathaway’s portfolio to see what Warren Buffett is invested in. Read more

We visualized the results of a 2024 student wealth survey to gain insight into how students are fairing financially. Read more

The wealth of American Millennials hit historic highs after the COVID-19 pandemic. Read more

Who were the wealthiest US presidents in history? A look at wealth, debt, and net worth of every US president since George Washington. Read more

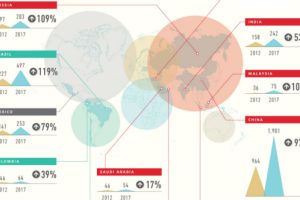
Where do the world’s millionaires live? In these infographics, we look at country, density per city, and also developing countries. Read more


