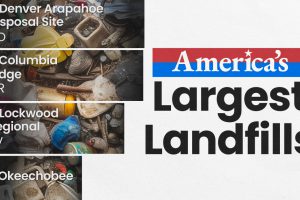
According to the EPA, the U.S. produced 292 million tons of solid waste in 2018, of which 150 million headed to some of the largest landfills in the country. Read more
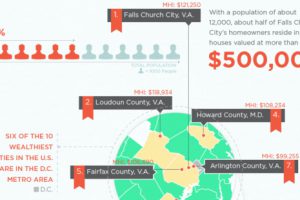
The richest counties in America by median income are not located near Silicon Valley or adjacent to Wall Street. They are not in oil rich Texas either. Read more

This infographic maps out all of the richest zip codes in America, leaving no country club or gated community unturned. Read more
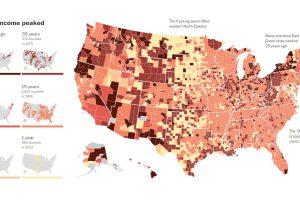
This map visualizes when the household median incomes of U.S. counties reached “peak income”. For more than 80% of counties, this was over 15 years ago. Read more
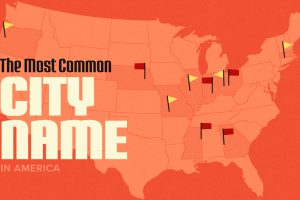
For incorporated areas with 20,000+ residents, there are two city names tied for first place. And the Simpsons live in one of them. Read more
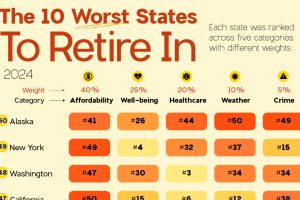
The worst states to retire in are those that are expensive and cold. But there’s a surprising warm weather entry as well. Read more
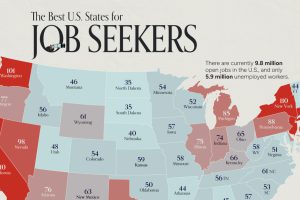
On average, there are 75 workers available for every 100 job openings across the country. Here’s how it varies by state. Read more
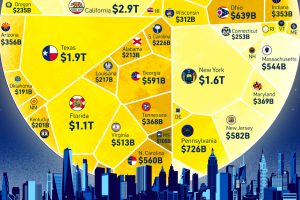
How does each state contribute to America’s overall GDP? This visualization breaks down the U.S. economy by state. Read more

An annual income anywhere between $360,000-$950,000 can grant entry into the top 1%—depending on where you live in America. Read more
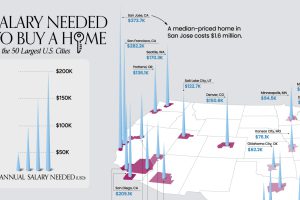
What does it take to own a home in the U.S. in 2023? Here’s a look at the salary needed for home ownership in the top 50 metro areas. Read more

