

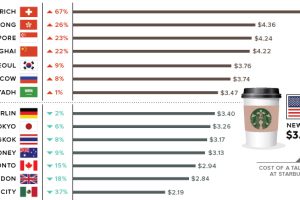
How good is a cup of joe at measuring the variance between different national currencies? We look at the Latte Index, developed by the WSJ, to find out. Read more
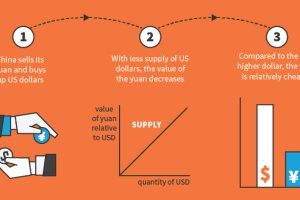
Why do the exchange rates between currencies fluctuate? This infographic looks at six major factors that drive these movements. Read more

How can you tell a fake $100 bill from a real one? In this visual we break down the anatomy and security features of American money. Read more
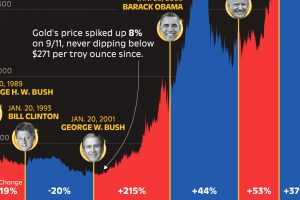
Gold prices increased by 37% during Biden’s presidency, but which U.S. president saw the greatest gold price increase during their term? Read more
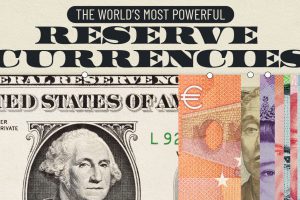
We breakdown $11.5 trillion in foreign exchange reserves to highlight the world’s top reserve currencies in 2024. Read more
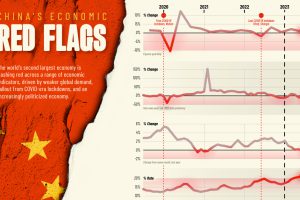
We chart six red flag indicators threatening China’s economy and it’s post-pandemic recovery, as well as global economic growth Read more
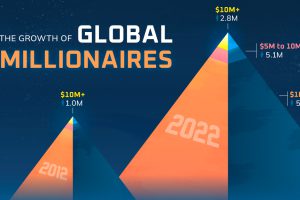
The world’s millionaire population has more than doubled in the last decade between 2012 and 2022. We visualize these numbers here. Read more
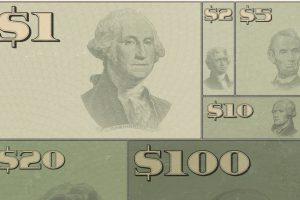
This graphic illustrates the amount of U.S. currency in circulation globally, by denomination, based on data from the Federal Reserve. Read more
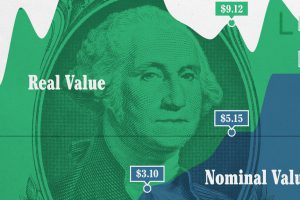
This graphic compares the nominal vs. inflation-adjusted value of the U.S. minimum wage, from 1940 to 2023. Read more