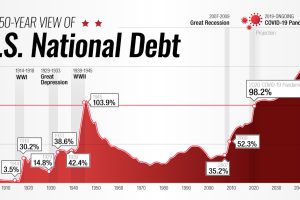
This interactive visual shows how the U.S. national debt has fluctuated since 1900, as well as projections all the way to 2050. Read more
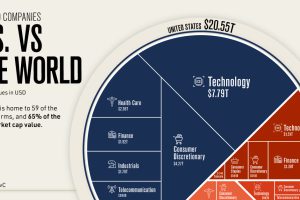
Where are the top 100 companies of the world located? We highlight the U.S. share of the top companies by market capitalization . Read more

America’s major cities are some of the most traffic congested in the world. Click to find out which ones made the top 10. Read more

The path to COVID-19 recovery varies worldwide—some countries have already recovered, while others will not be back to normal for years. Read more

In America, tech jobs pay about 61% more than the average salary. Here’s a look at which states have the highest tech salaries. Read more
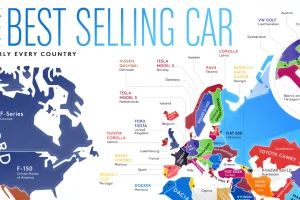
From American trucks to European sedans, this map shows the best-selling vehicles in the world. Read more

How big is the world’s nuclear arsenal? Here are the stockpiles of the nine countries with nuclear weapons. Read more

From Fords in the Midwest to Toyotas on the coasts, here are the best selling vehicles in America, visualized by state. Read more

Tech, finance or energy giant? We mapped the biggest companies by market cap and industry. Read more
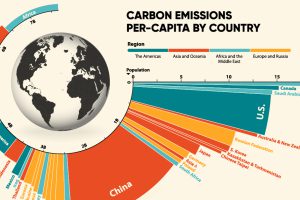
33.6 Gt of CO2 was emitted across the world in 2019. Here we visualize the global per capita CO2 emissions by country and region. Read more

