
Fewer than 12% of global billionaires are women, but they still hold massive amounts of wealth. Who are the 50 richest women in the world? Read more
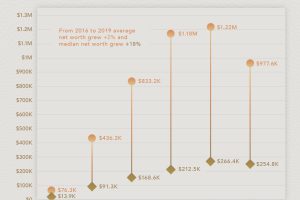
How much is the average American worth at different ages? This chart reveals the average net worth by age in the U.S. Read more

How have new business start-ups in the U.S. been impacted by COVID-19? New data reveals the resilience of the entrepreneurial spirit in America. Read more
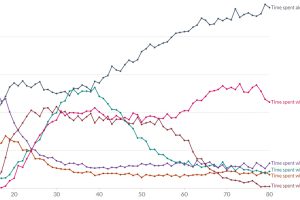
Ever wondered who Americans spend the most time with? This chart assesses how many minutes per day Americans spend with different people. Read more
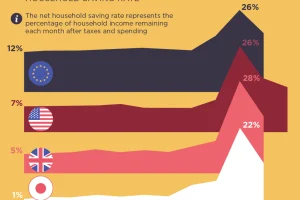
Were people more frugal during the pandemic or did they break the bank? This visual assesses the saving rates across different countries. Read more
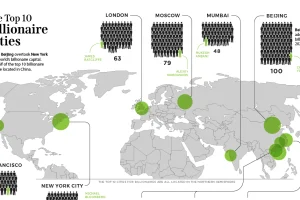
Where do the most billionaires live? For years, NYC has topped the list of billionaire cities, but 2020 marked a monumental shift. Read more

South Africa recorded the highest wealth inequality in 2023, as measured by the Gini index. Which other countries made the top 10? Read more

DC, the nation’s capital recorded the highest violent crime rate in 2022, at 812 incidents per 100,000 residents. Read more
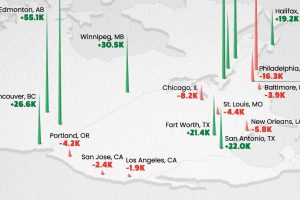
Toronto was the fastest-growing city in Canada and the U.S. in 2023, adding over 125,000 people to its population. Read more
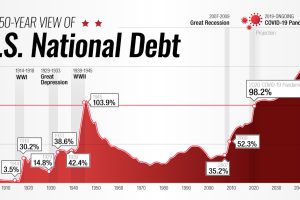
This interactive visual shows how the U.S. national debt has fluctuated since 1900, as well as projections all the way to 2050. Read more

