
By popular demand from our audience, we show how the U.S. is gradually becoming a cashless society. Read more

We compare the populations of India and China to other top countries and regions for a unique perspective on the world’s demographics. Read more

The wealth of American Millennials hit historic highs after the COVID-19 pandemic. Read more
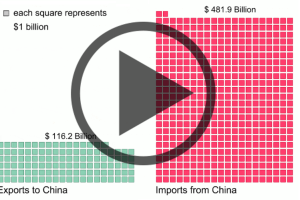
Donald Trump claims that the U.S. keeps losing to China in trade. His numbers are technically untrue, but they’re not far off. Read more
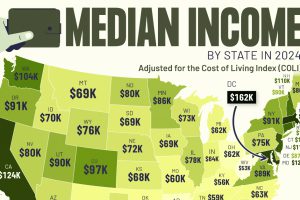
This graphic shows median income by state in 2024, adjusted for cost of living. Can you guess where it’s the highest? Read more

In June 2022, the U.S. Supreme Court overturned Roe v. Wade, opening the door for states to make their own decisions regarding abortion legality. How did states react? Read more
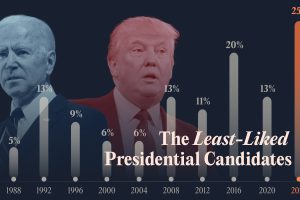
A quarter of Americans hold unfavorable views of both major party candidates Read more
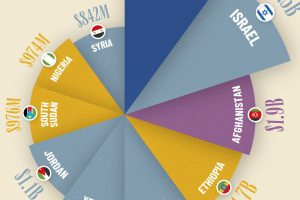
See which countries received the most U.S. foreign aid in fiscal year 2022, based on the latest official numbers. Read more
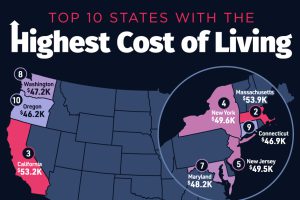
Hawaii secured the top spot as the U.S. state with the highest cost of living, with an average annual expenditure of $55,491. Read more
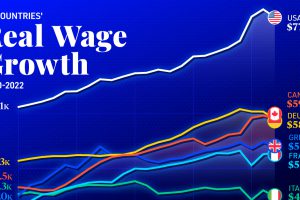
G7 countries have generally seen steady wage growth since 2000, but some certain countries are lagging behind. Read more

