

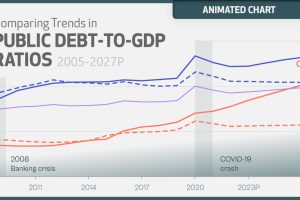
The surge in global debt poses significant risks to government balance sheets. Here’s where it’s projected to reach over the next five years. Read more
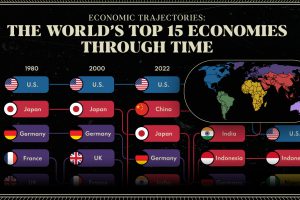
We provide a historical and predictive overview of the top economies in the world, including projections all the way to 2075. Read more

This graphic breaks down the number of Costco stores globally, providing insight into the retailer’s global presence. Read more
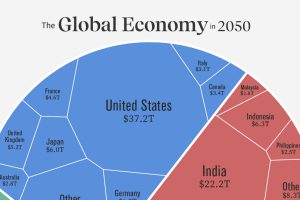
Asia is expected to represent the world’s largest share of real GDP in 2050. See how this all breaks down in one chart. Read more
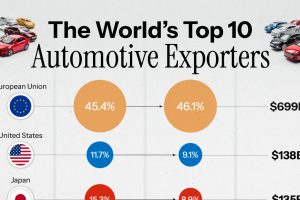
Data from the World Trade Organization highlights the world’s 10 largest automotive exporters in 2022. Read more

SUVs and trucks were the best selling vehicle in almost every US state for 2022, but a few surprises remain. Read more
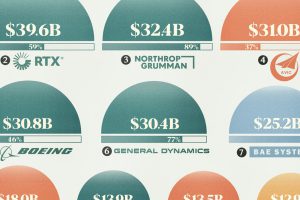
With billions in defense contracts handed out annually, who are the key players profiting? View this graphic to find out. Read more
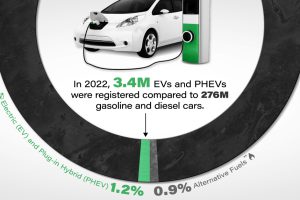
Although sales have been climbing, EV market share in the U.S. remains low as a percentage of all vehicles registered on the road. Read more
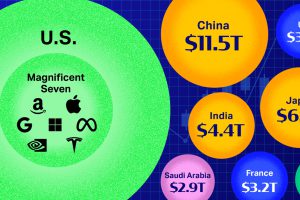
This graphic illustrates the biggest stock markets by country, providing a unique breakdown of $110 trillion in valuation. Read more

This graphic compares the nominal vs. inflation-adjusted value of the U.S. minimum wage, from 1940 to 2023. Read more