


A train transporting a number of potentially dangerous chemicals derailed near the Ohio–Pennsylvania border. This infographic explains what happened Read more

In this graphic we explore the world’s declining fertility rate over the last 60 years and the disparity in fertility rates between nations Read more
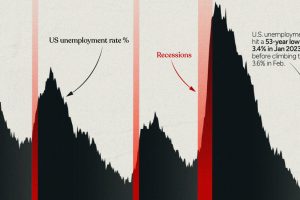
This infographic examines 50 years of data to highlight a clear visual trend: recessions are preceded by a cyclical low in unemployment. Read more
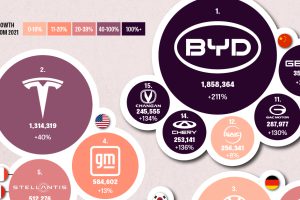
This graphic explores the latest EV production data for 2022, which shows BYD taking a massive step forward to surpass Tesla. Read more

This graphic visualizes the market capitalizations of America’s 15 largest semiconductor companies. Read more

Nearly 800,000 AI jobs were posted in the U.S. throughout 2022. View this graphic to see a breakdown by state. Read more
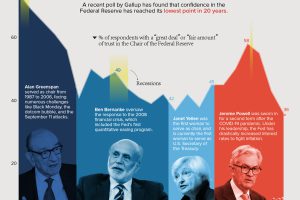
Public trust in the Federal Reserve chair has hit its lowest point in 20 years. Get the details in this infographic. Read more
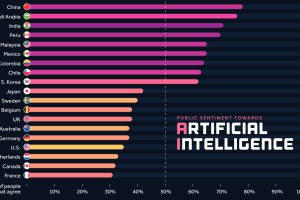
We visualize survey results from over 19,000 adults across 28 countries to see how attitudes towards AI differ around the world. Read more

Getting ready for retirement? See which states score the highest in terms of affordability, quality of life, and health care. Read more
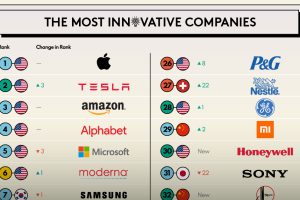
Which companies prioritize innovation the most? This infographic highlights BCG’s 2023 Most Innovative Companies ranking. Read more