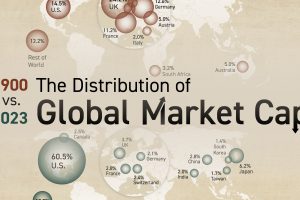
We breakdown the world’s largest stock markets by country, highlighting the massive growth of the U.S. and Asia. Read more
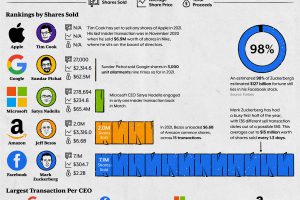
Big Tech is worth trillions, but what are insiders doing with their stock? We breakdown Big Tech CEO insider trading during the first half of 2021. Read more
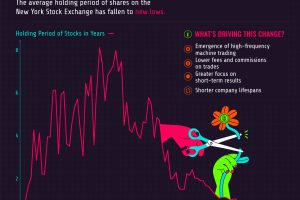
The average holding period of shares on the New York Stock Exchange (NYSE) is now less than one year. Read more
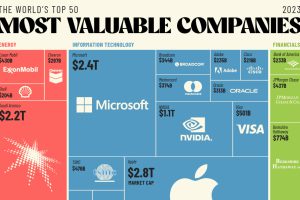
The world’s 50 most valuable companies represent over $25 trillion in market cap. We break this massive figure down by company and sector. Read more
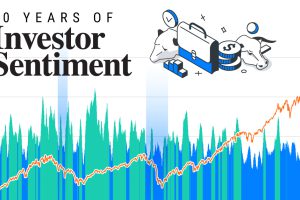
Here’s how investor sentiment has shifted over the last three decades, from the Dotcom boom to present-day. Read more
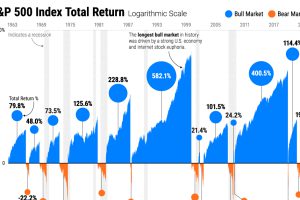
Stock market cycles often rhyme throughout history, shaped by monetary policy, consumer spending, and herd behavior. Read more
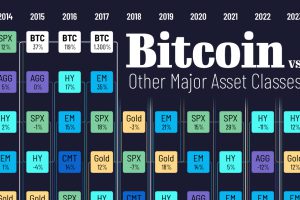
Bitcoin returns surged 156% in 2023, marking the end of the crypto winter. Here’s how its performance compared to major asset classes. Read more
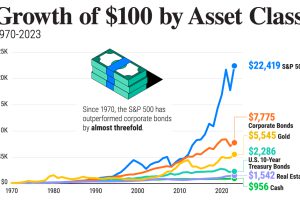
In this graphic, we show asset class returns across U.S. equities, bonds, real estate, gold and cash since 1970. Read more


