The results of Barron’s poll of top Wall Street analyst predictions for 2015. Read more

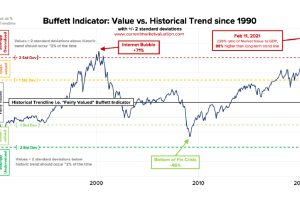
At 228%, the Buffett Indicator has reached all-time highs, which means America’s stock market value is currently more than double the country’s GDP. Read more

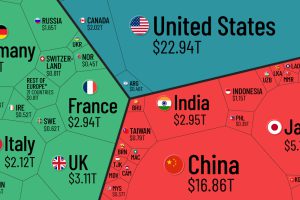
Which countries and regions contribute the most to the world economy? In this infographic, we break down all $94 trillion of global GDP by country. Read more

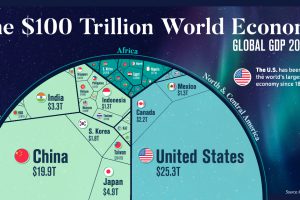
Despite ripple effects from conflict and inflation, global growth continues. According to the IMF, the global GDP will hit $104 trillion by end of year. Read more

How does each state contribute to America’s overall GDP? This visualization breaks down the U.S. economy by state. Read more

Services-producing industries account for the majority of U.S. GDP in 2023, followed by other private industries and the government. Read more

