

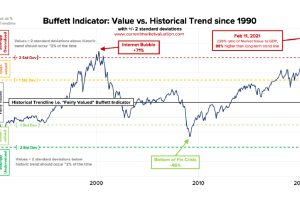
At 228%, the Buffett Indicator has reached all-time highs, which means America’s stock market value is currently more than double the country’s GDP. Read more
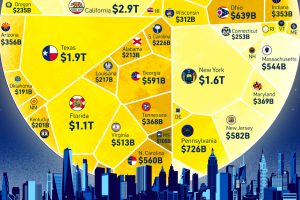
How does each state contribute to America’s overall GDP? This visualization breaks down the U.S. economy by state. Read more
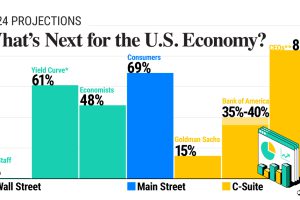
In this graphic, we show the probability of a U.S. recession in 2024, based on forecasts from Wall Street, Main Street, and the C-Suite. Read more
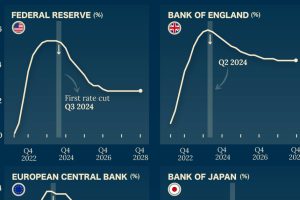
Which economies are expected to see interest rates rise, or fall? We highlight IMF forecasts for international interest rates through 2028. Read more
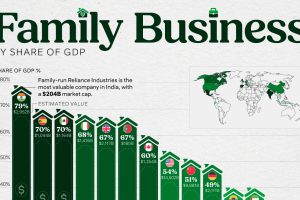
Family-owned businesses are key drivers of the global economy. This graphic shows their economic contribution to GDP, by country. Read more
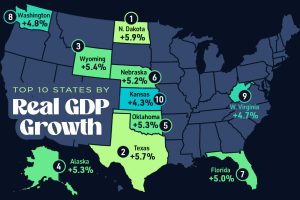
This graphic shows the states with the highest real GDP growth rate in 2023, largely propelled by the oil and gas boom. Read more
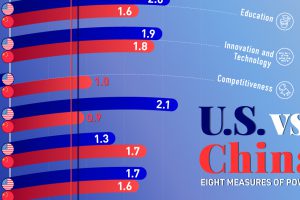
The balance of power between the U.S. and China is influenced by many forces, spanning from trade and military strength to economic output. Read more

As the economy shifts, see which occupations are expected to have the most job growth over the next decade—and what they pay. Read more