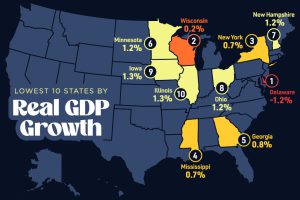
In this graphic, we show where real GDP lagged the most across America in 2023 as high interest rates weighed on state economies. Read more
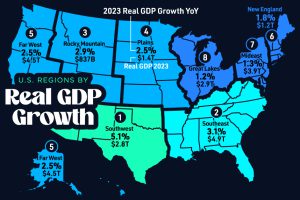
While southern regions drove economic growth in 2023, others in the north languished. We show U.S. regions, by real GDP growth last year. Read more
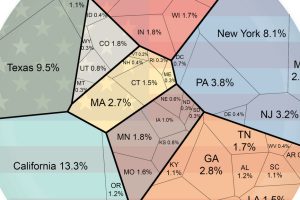
Ever wonder how your state compares in terms of economic output? This simple visualization compares the economies of every U.S. state. Read more

The U.S. national debt is climbing at a rapid pace, increasing by $1 trillion since the start of the year alone. Read more

Despite high interest rates, mortgage delinquencies remain low. We show the top financial reasons for missing home loan payments in 2024. Read more

Today, the share of Americans’ financial assets that are invested in public stocks is near all-time highs. Read more
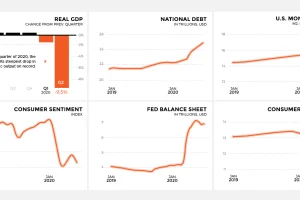
As COVID-19 spreads around the U.S. leaving economic upheaval in its wake, this snapshot reveals how major economic indicators are trending Read more
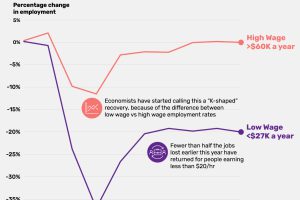
The current recession is the most unequal in modern history, with employment rates diverging greatly between high versus low wage workers. Read more
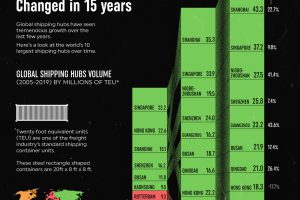
The largest shipping hubs have gotten bigger and busier. Here’s a look at how the global landscape has evolved over the past 15 years. Read more
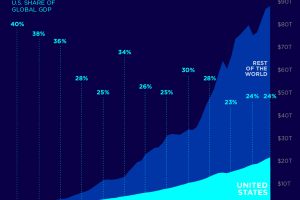
As of 2019, the U.S. made up almost a quarter of the global economy. This chart shows how the U.S. Share of the global GDP has changed over time. Read more

