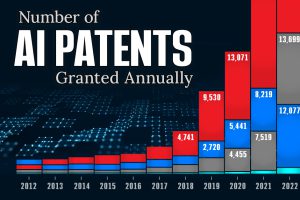
See which countries have been granted the most AI patents each year, from 2012 to 2022. Read more
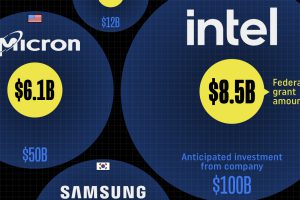
Intel, TSMC, and more have received billions in subsidies from the U.S. CHIPS Act in 2024. Read more
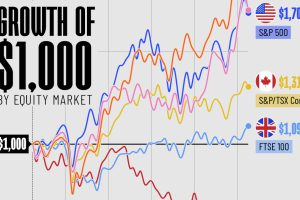
In this graphic, we’ve visualized stock market growth by country over the past five years using major indices. Read more
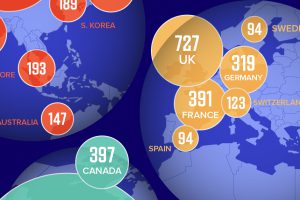
Over the past decade, thousands of AI startups have been funded worldwide. See which countries are leading the charge in this map graphic. Read more

We visualized the latest data on Berkshire Hathaway’s portfolio to see what Warren Buffett is invested in. Read more

We visualized the results of a 2024 student wealth survey to gain insight into how students are fairing financially. Read more

In this infographic, we list the most stolen vehicles in the U.S. in 2023, according to the National Insurance Crime Bureau. Read more
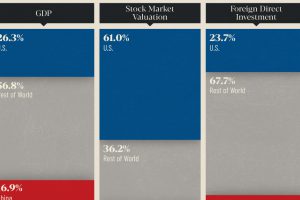
How do the world’s two largest economies compare? We look at the economies of U.S. and China across GDP, stock markets, and FDI. Read more
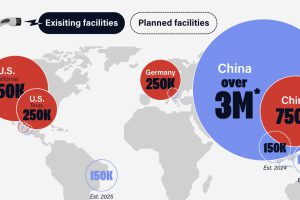
We map the locations of Tesla and BYD’s present and future EV factories, along with their estimated maximum output. Read more

A single adult needs to make at least $116k annually to live comfortably in Massachusetts. Read more

