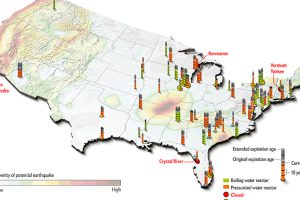
It’s no secret that China plans to build dozens of nuclear reactors in the coming years. Domestically, nuclear has taken a back seat in the United States. Read more
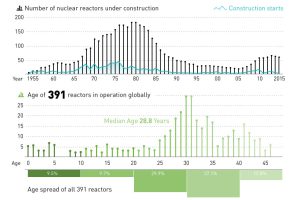
The majority of the 391 nuclear reactors in global operation were built many years ago, and aging reactors are beginning to be a problem for the industry. Read more
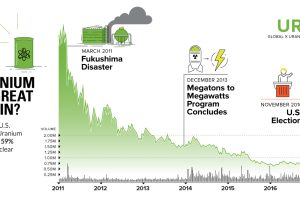
Uranium was the most hated commodity for the last 6 years – but things are changing. Trump could be a boon to the metal, with miners up 59% since election… Read more
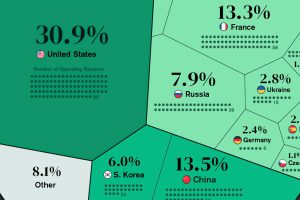
Nuclear power accounted for 10% of global electricity generated in 2020. Here’s a look at the largest nuclear power producers. Read more
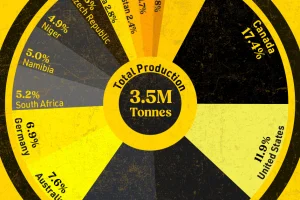
Uranium production is concentrated in a few countries worldwide. This graphic shows the top producers globally since 1945. Read more
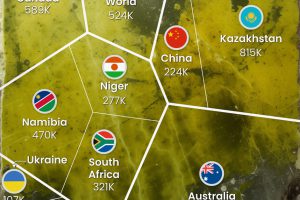
We visualize the distribution of the world’s uranium reserves by country, with 3 countries accounting for more than half of total reserves. Read more

We round up the most popular, most discussed, and most liked visualizations of the month on Voronoi, our new data storytelling platform. Read more


