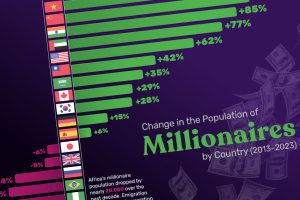
This chart shows the countries with the fastest growing (and fasted declining) millionaire populations in the world over the last decade. Read more
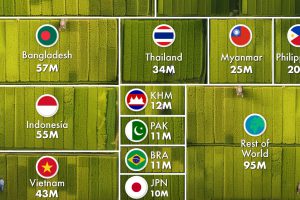
The world’s most populous countries, China and India, top the countries with the largest rice production in 2022. Read more
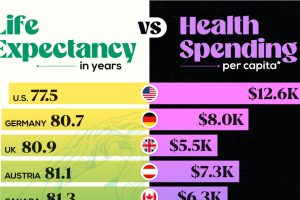
America’s per capita health spend is now past $12,500, but for what gains? A quick comparison with its peers. Read more

Where are the top 100 universities in the world located? We look at the World University Rankings 2024 to find out. Read more
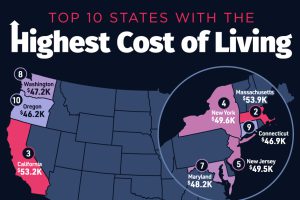
Hawaii secured the top spot as the U.S. state with the highest cost of living, with an average annual expenditure of $55,491. Read more
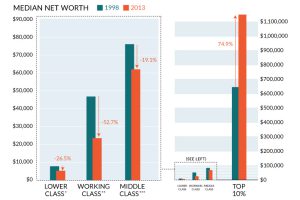
It’s clear to many Americans that the ‘system’ isn’t working for most people, and this chart sums up the wealth inequality problem perfectly. Read more
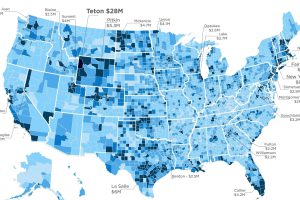
To make it into the Top 1% of US earners, you must make $521k. However, avg income of the 1% varies wildly at a county level, ranging from $127k to… Read more
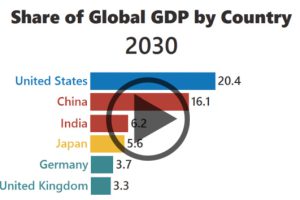
The rise of Asia has been swift. Here’s three GIFs that show the speed of China in becoming an economic power house – and how India is hot on their… Read more

This massive diagram shows all energy created in the U.S., and where it goes. It’s not sexy, but it gives a great 10,000 ft overview of energy consumption. Read more
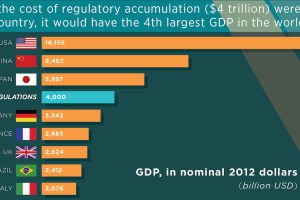
There is now a 180,000 page regulatory burden at the federal level, and one study finds the cumulative impact to be in the trillions. Read more

