This map shows the most dangerous cities in the U.S. in terms of the violent crime rate per 1,000 residents. Read more
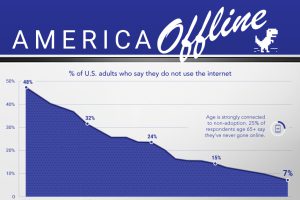
Internet adoption is widespread in the U.S. In fact, only 7% of Americans do not use the internet. Who are these non-adopters? Read more
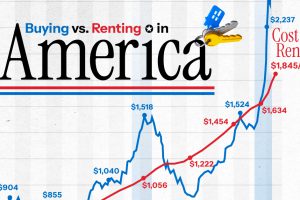
The U.S. has witnessed the biggest numerical gap in the monthly cost between buying a home and renting in over 50 years. Read more

Here’s a preview of the 2023 Utility Decarbonization Index, which tracks the decarbonization progress of the largest U.S. utilities. Read more
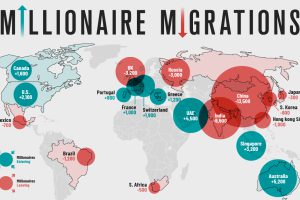
Where do the world’s wealthiest people want to live? This map tracks the migration of the world’s High Net Worth Individuals (HNWIs). Read more
In this graphic, we visualize whether major electricity-consuming countries are on track to meet their 2030 renewable energy targets. Read more

Services-producing industries account for the majority of U.S. GDP in 2023, followed by other private industries and the government. Read more
Mirroring the country’s rapid economic growth, India’s FDI (foreign direct investment) inflows have skyrocketed over the last twenty years. Read more
This graphic ranks government debt by country for advanced economies, using their gross debt-to-GDP ratio. Read more


