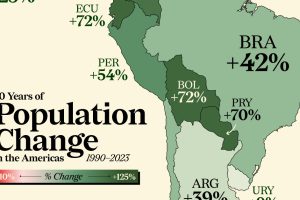
Nearly every country in the Americas has seen a population boom in the last three decades. Some have doubled in size. Read more

We dug into the World University Rankings 2024 to uncover America’s best universities across nine census regions. Read more

About 46% of the American workforce, or 62 million people, are employed in a small business. Here’s the share breakdown by state. Read more
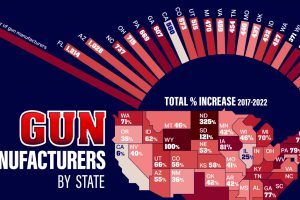
In 2022, the U.S. government agency in charge with enforcing national gun laws issued 18,784 gun manufacturer licenses. Read more
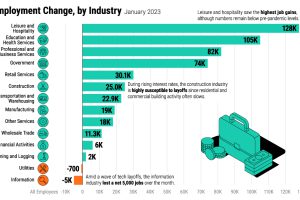
The U.S. labor market is remarkably strong, with a 3.4% unemployment rate. Which sectors are seeing the highest job gains in 2023? Read more
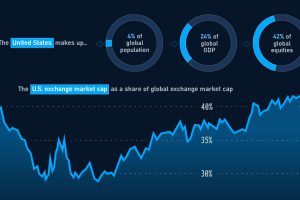
Despite having 4% of the world’s population, the value of U.S. equities still make up over 40% of the global total. Read more
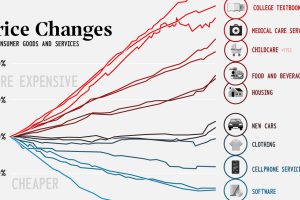
This century has seen divergent price movement. Many consumer goods are cheaper, while critical categories like health and education have skyrocketed. Read more
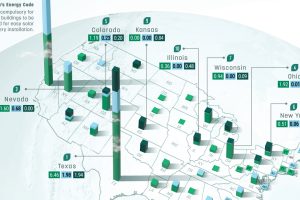
This graphic describes new U.S. renewable energy installations by state along with nameplate capacity, planned to come online in 2023. Read more
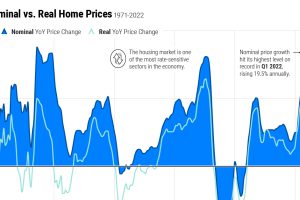
Home price growth has moderated amid rising interest rates and a narrow housing supply. Here’s how prices compare to historical trends. Read more
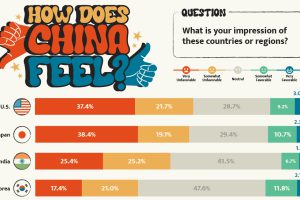
What is the Chinese public’s view of world powers? This visual breaks down Chinese sentiment towards other countries. Read more

