
Extra, extra read all about it—these 25 popular U.S. newspapers are trending downwards in their daily print circulation year-over-year. Read more
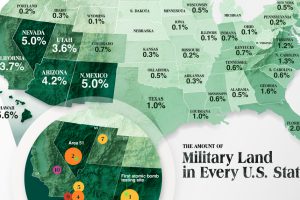
The U.S. military’s real estate portfolio is valued at $749 billion. Here’s a look at how much land the U.S. military controls in each state. Read more
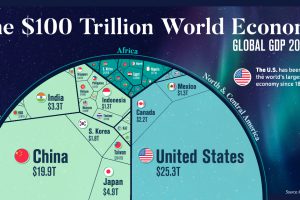
Despite ripple effects from conflict and inflation, global growth continues. According to the IMF, the global GDP will hit $104 trillion by end of year. Read more
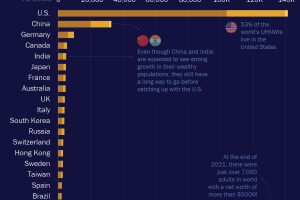
Developing countries are creating wealth like never before, but the majority of the world’s ultra-wealthy people still live in the United States. Read more
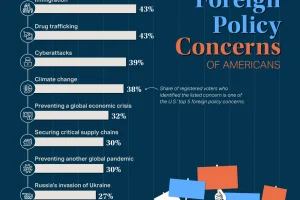
As the world’s superpower, the U.S. has major influence in world events. Which foreign policy concerns stand out for Americans? Read more
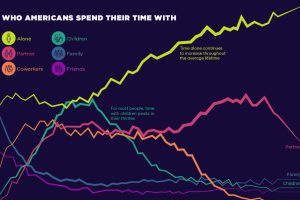
Social connections evolve throughout our lifetimes. Here we chart how much time Americans spend with others, and who that time is spent with. Read more

Every year, there are hundreds of thousands of U.S. immigration visas issued by the government. See which countries receive the most in this visualization. Read more

How much oil, coal, and natural gas do we extract each year? See the scale of annual fossil fuel production in perspective. Read more

This infographic breaks down battery manufacturing capacity by country in 2022 and 2027. Read more


