

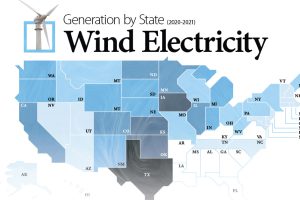
Wind energy is the largest source of renewable electricity in North America. This graphic maps U.S. states by wind electricity generation. Read more
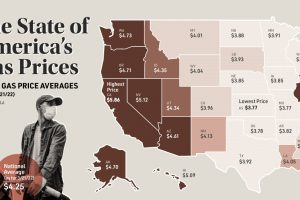
This map looks at gas prices across various states, and historical context for today’s sky-high prices at the pump. Read more
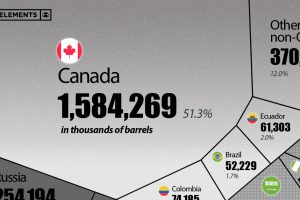
This visualization breaks down U.S. oil imports by country for 2021, showing the split by OPEC and non-OPEC nations. Read more
Just how powerful are nuclear bombs? Here’s a look at the top 10 largest nuclear explosions. Read more

Which countries dominate outer space? This visual displays the number of objects every country has launched into space over time. Read more
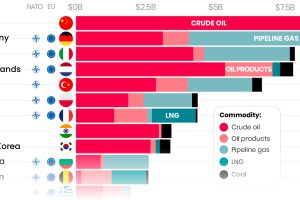
Here are the top importers of Russian fossil fuels since the start of the war. Read more
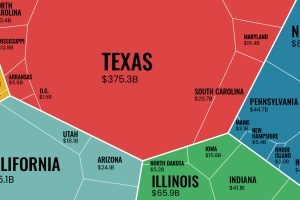
The U.S. exported $1.8 trillion worth of goods in 2021. This infographic looks at where that trade activity took place across the nation. Read more

As geopolitical tensions began to heat up around the world, which nations were the top military spenders in 2021? Read more
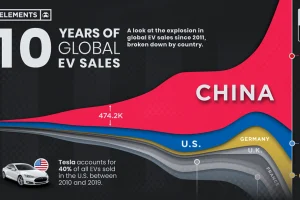
Global EV sales have grown exponentially, more than doubling in 2021 to 6.8 million units. Here’s a look at EV sales by country since 2011. Read more
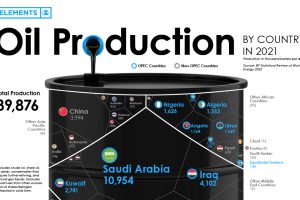
Global oil production averaged 89.8 million barrels of oil per day in 2021. Here are the world’s largest oil producers. Read more