

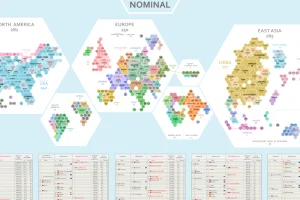
Where does the world’s economic activity take place? This cartogram shows the $94 trillion global economy divided into 1,000 hexagons. Read more
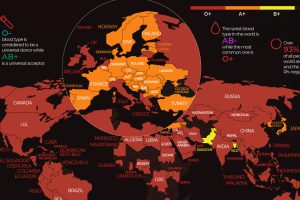
There are 8 common blood groups but 36 human blood types in total. Here we map the most widespread blood types in every country in the world. Read more
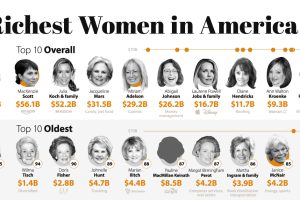
Only 12% of billionaires in the U.S. are women. Who is part of this prestigious group of the richest women in America? Read more
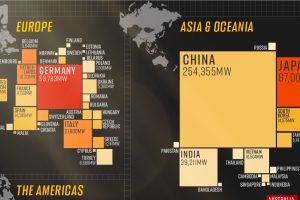
In 2020, solar power saw its largest-ever annual capacity expansion at 127 gigawatts. Here’s a snapshot of solar power capacity by country. Read more
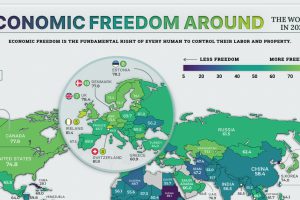
The global average economic freedom score is at the highest its been in 27 years. Here we map the economic freedom score of nearly every country. Read more
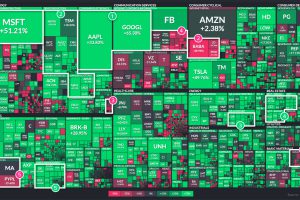
2021 was yet another tumultuous year. Which stock market sectors thrived during the twists and turns of the last 12 months, and which faltered? Read more
Global energy transition investment hit $755 billion in 2021. This chart ranks the top 10 countries by energy transition investment. Read more
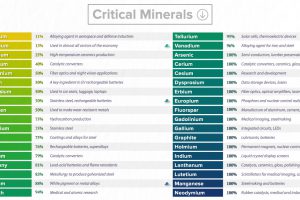
This graphic lists all minerals that are deemed critical to both the economic and national security of the United States. Read more
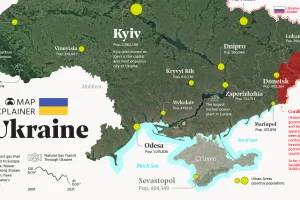
Ukraine has made the headlines due to the ongoing tensions with Russia. In this map infographic, we examine Ukraine from a structural point of view. Read more
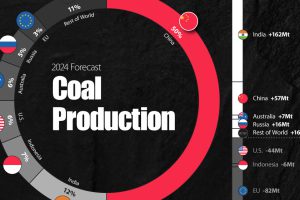
Coal came under scrutiny for its high carbon emissions at COP26, but many countries are forecasted to increase coal production until 2024. Read more