

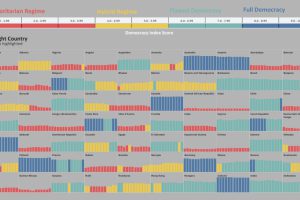
Has the world become more or less free? To find out, this graphic highlights the changing state of democracy in 167 countries since 2006. Read more
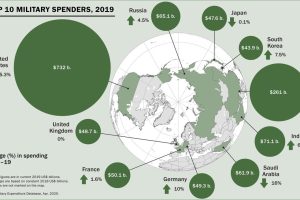
Global military spending surpassed $1.9 trillion in 2019, but nearly 75% of this total can be traced to just 10 countries. Read more
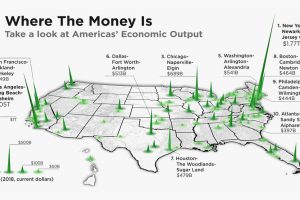
The total U.S. GDP stands at a whopping $21 trillion, but which metro areas contribute to the most in terms of economic output? Read more
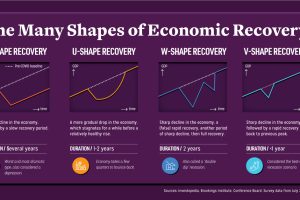
Economic recovery from COVID-19 could come in four shapes—L, U, W, and V. What do they mean, and what do global CEOs see as the most likely? Read more
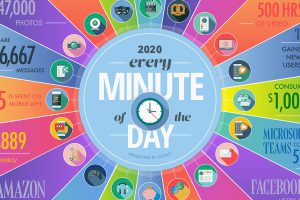
A lot can happen in an internet minute. This graphic looks at the enormous numbers behind the online services billions use every day. Read more
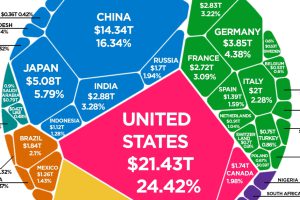
The world’s total GDP crested $88 trillion in 2019—but how are the current COVID-19 economic contractions affecting its future outlook? Read more
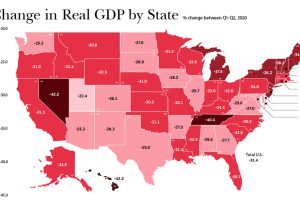
In just a few months, the U.S. economy reeled from COVID-19. As real change in GDP suffered, which states and industries were the hardest-hit? Read more
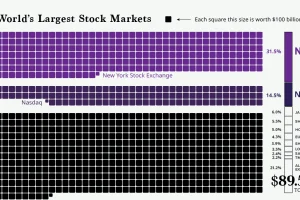
The world’s stock market exchanges have a combined market cap of $89.5 trillion, with American exchanges making up all most half that value. Read more
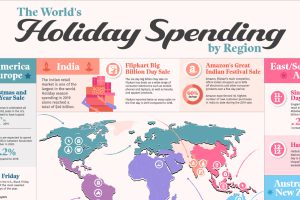
This graphic illustrates some of the largest and most anticipated retail holidays by region and explores their origins. Read more
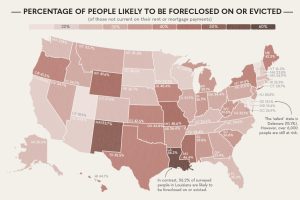
Which U.S. states are most at risk of experiencing mass evictions and foreclosures in the next two months? Read more