

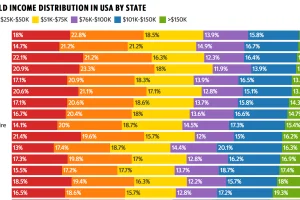
This colorful data visualization breaks down the household income of each U.S. state into six income brackets. Read more
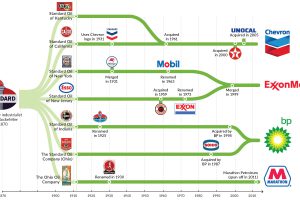
In 1911, John D. Rockefeller’s Standard Oil was broken up into 34 pieces by the Supreme Court. Today, the remnants form the base of the U.S. oil industry. Read more
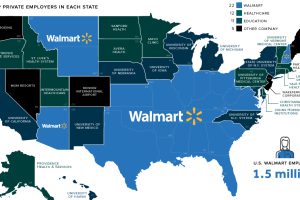
Walmart employs 1.5 million people across the country – and the retail behemoth is now the largest private employer in 22 states. Read more
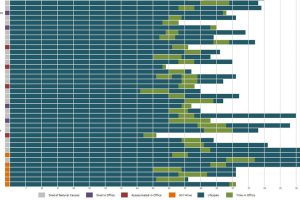
When do presidents start their first terms, on average? Who were the youngest and oldest presidents? It’s all here in this visualization. Read more
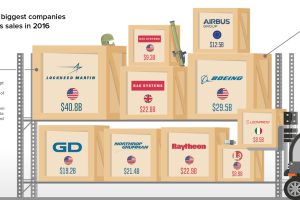
Want a fighter jet or a new tank? These ten companies – most of them based on the U.S. – are the firms that sell the most weapons in the… Read more

How have state populations changed over a century? This bump chart shows the population rank of every state in the United States over 1917-2017. Read more
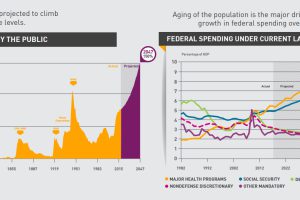
The national debt keeps growing and growing. But what’s driving that trend, and when will the situation reach a critical mass of attention? Read more
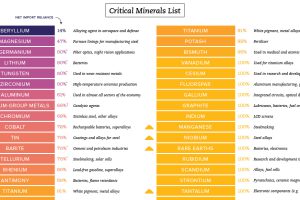
These critical minerals are needed for tech, defense, and industry, yet most of them are mainly imported from outside of the United States. Read more
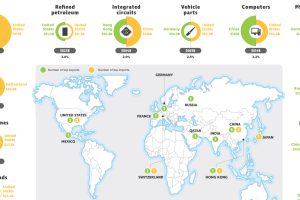
What are the most traded goods in the world? This map shows the 18 top goods, as well as the biggest importer and exporter of each good. Read more

The U.S. has registered 1,589 executions since 1977. Read more