

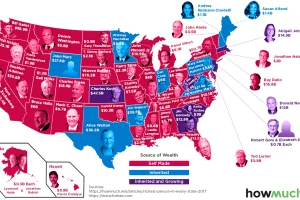
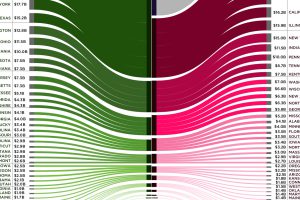
With fortunes ranging from $88.9B (Bill Gates) to $340M (Leonard Hyde), here is the richest person in each state in 2017, according to Forbes. Read more
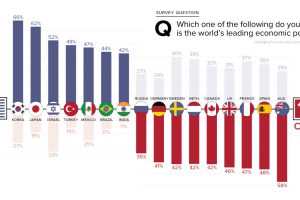
Which country is the world’s leading economic superpower? The world is strangely divided on this question – see the surprising answers in this chart. Read more
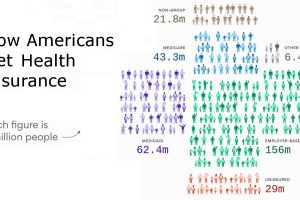
Here’s how Americans get healthcare coverage, using visualizations to show the numbers both nationally and for each individual state. Read more
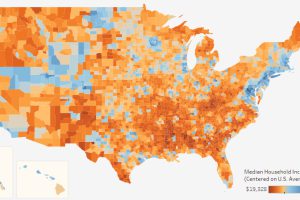
This interactive data visualization allows you to see median household income levels for every U.S. county – as well as the ability to sort data by state. Read more
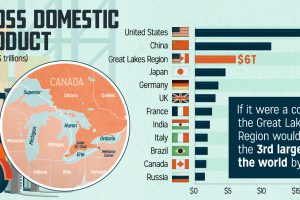
We don’t think of the Great Lakes as its own economy, but maybe we should. It’s tightly integrated by trade, and generates $6 trillion in GDP each year. Read more
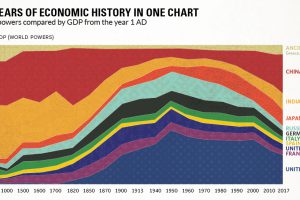
This chart compares the economies of major powers from 1AD all the way until today, showing the impact of the Industrial Revolution and re-emergence of Asia. Read more
Canada is the largest international trade partner for most U.S. states – use this visualization to see how connected every state is to neighbors to the north. Read more
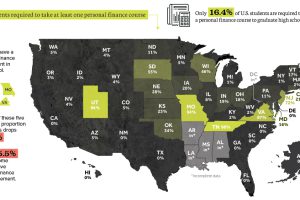
A new study finds that very few U.S. students have guaranteed access to a personal finance course in high school – raising concerns about financial literacy. Read more
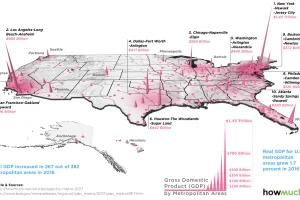
Which cities have the highest economic production in the country? This 3d map highlights GDP by metro area based on recent data. Read more
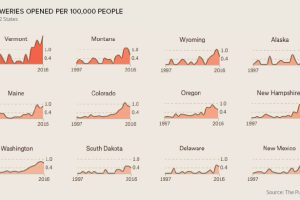
The craft beer boom is a nation-wide trend, but certain cities have an outsize influence on the industry – and beer lovers. Read more