

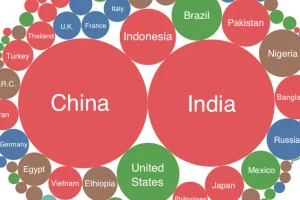
Every country is represented in this deceptively simple visualization. We then show all U.S. counties using a similar method, which might make you feel small! Read more
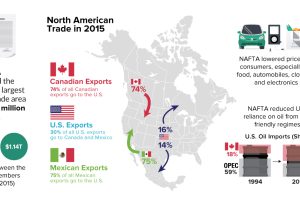
Everything you need to know about NAFTA, including a comparison of economic numbers before and since the agreement was signed in 1994. Read more

The American Society of Civil Engineers says that if the growing infrastructure gap is not closed, it will create a $4 trillion drag on U.S. GDP by 2025 Read more
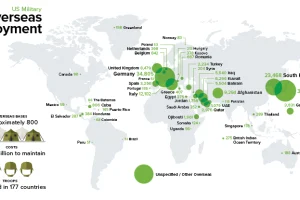
The U.S. spends more on defense than the next 7 countries combined. Part of that money goes to supporting 200,000 troops abroad in 177 countries. Read more
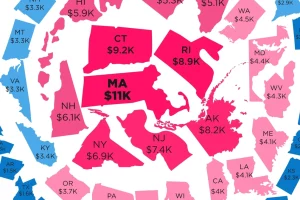
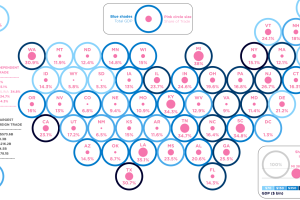
In addition to federal debt, states and municipalities also incur debt on your behalf. Here are the states with the most and least state debt per capita. Read more
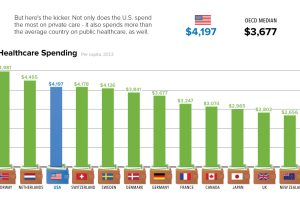
Even with a healthcare system that leans heavily on the private sector, the U.S. government actually spends more money on public healthcare than most countries. Read more
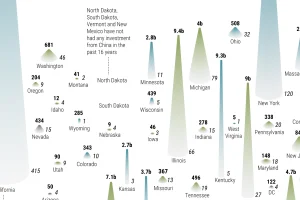
China has invested over $1 trillion overseas in the last decade, with the U.S. being the top destination. See the states and industries that cashed in. Read more

A timeline of U.S. monetary history shows the major events, the changing money supply, and the falling buying power of the U.S. dollar over time. Read more
With the risk of a trade war heating up, here are the U.S. states that rely the most on foreign trade as a percentage of GDP. Read more

Is the oldest business in your state a well-known brand, or a mom-and-pop shop? This infographic shows the oldest company in each state in the U.S. Read more