
Nearly 6,000 satellites circle our tiny planet. About 60% are space junk, 40% are operational—and hundreds more are launched every year. Read more
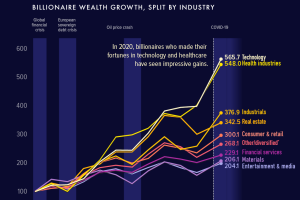
After the coronavirus-related market crash in early 2020, billionaires across every sector saw a double-digit increase in wealth. Read more
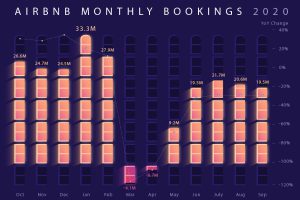
From rooms to revenue, this infographic breaks down the numbers behind the business of Airbnb—one of the most successful IPOs of 2020. Read more
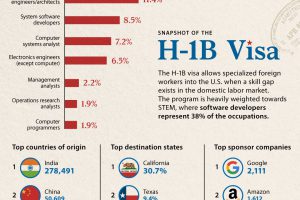
This infographic covers all the key charts and data for the H1-B visa, which grants foreign skilled workers employment in the U.S. Read more
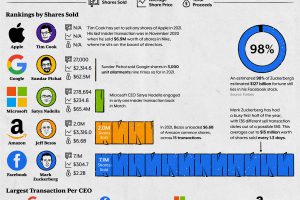
Big Tech is worth trillions, but what are insiders doing with their stock? We breakdown Big Tech CEO insider trading during the first half of 2021. Read more
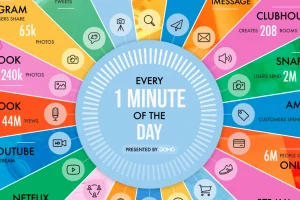
A lot can happen in an internet minute. This stat-heavy graphic looks at the epic numbers behind the online services billions use every day. Read more

