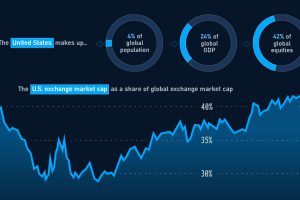
Despite having 4% of the world’s population, the value of U.S. equities still make up over 40% of the global total. Read more

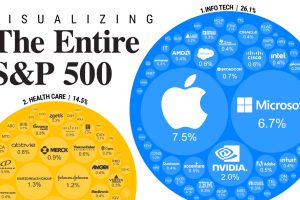
S&P 500 companies make up $34 trillion in market value combined. This graphic shows how they break down by weight and sector. Read more

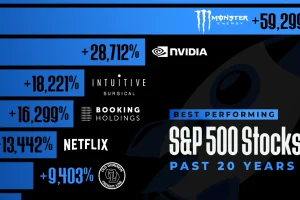
Which S&P 500 stocks have seen the highest returns over the last two decades? This graphic shows the top 15 performers. Read more


