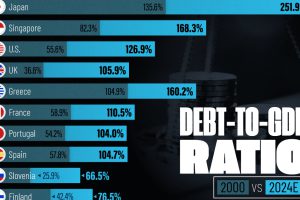
See how much the debt-to-GDP ratios of advanced economies have grown (or shrank) since the year 2000. Read more

China has grown its nuclear capacity over the last decade, now ranking second on the list of top nuclear energy producers. Read more

Older, better-educated adults are winning the savings game, reveals a January survey by the National Opinion Research Center at the University of Chicago. Read more

The IMF has released its economic growth forecasts for 2024. How do the G7 and BRICS countries compare? Read more

Lions, tigers, and bears, oh my!—these animals do not feature on this list of popular American household pets. Read more

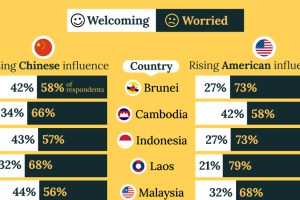
A significant share of respondents from an ASEAN-focused survey are not happy about rising American and Chinese influence in the region. Read more

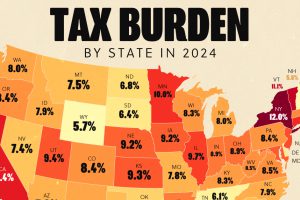
Tax burden measures the percent of an individual’s income that is paid towards taxes. See where it’s the highest by state in this graphic. Read more

A survey during peak tax filing season reveals two big complaints that Americans have with the federal tax system. Read more

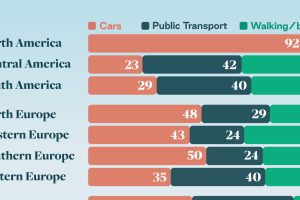
Examining how people get around using cars, public transit, and walking or biking, and the regional differences in usage. Read more


