
Nintendo built vacuum cleaners and Paypal made security software. That’s not how we know these brands today – see 8 startup pivots that changed the world. Read more
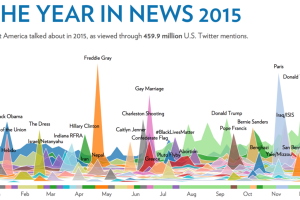
This visualization analyzes 459.9 million tweets over the course of the year to show the magnitude and timing of trending news stories in 2015. Read more
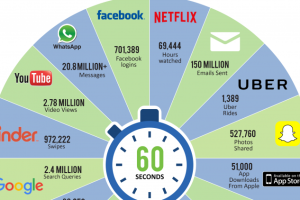
Here’s the mind-boggling amount of Google searches, Uber rides, and Facebook logins happen in an internet minute in 2016. Read more
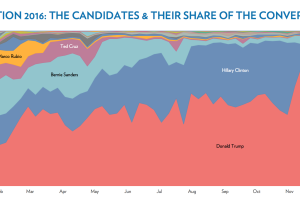
An in-depth analysis of over 2 billion tweets shows who and what dominated the news cycle of 2016 in the United States. Read more
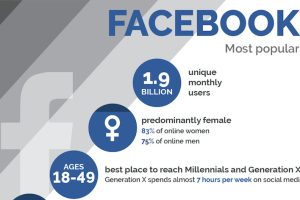
The social networks are all different, and smart businesses are tailoring their messaging based on the fundamental demographic differences between them. Read more
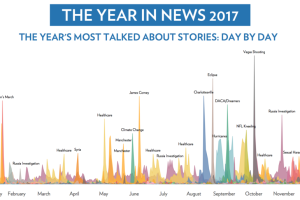
What were the most talked about news stories of 2017? This infographic crunches the data on 2.8 billion tweets to find out. Read more
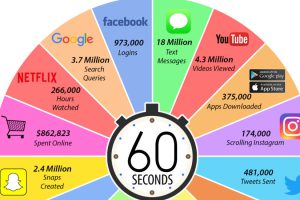
Not much happens in a minute of everyday life – but on the internet, it’s a different story! See the web’s scale visualized with this internet minute chart. Read more
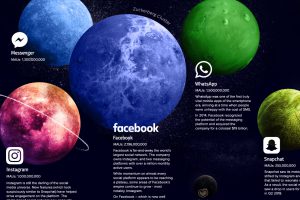
Explore the social media universe in this giant infographic, where every platform is a planet sized based on the amount of users it has. Read more
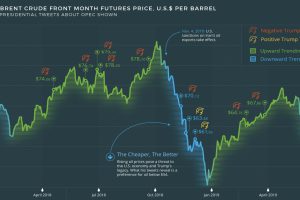
What goes through the head of a U.S. president? The tweets of U.S. President Donald Trump reveal a contentious relationship with the price of oil and OPEC. Read more
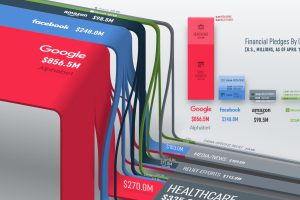
Breaking down the $1.25 billion in funding announced by Big Tech companies to fight the pandemic. Read more

