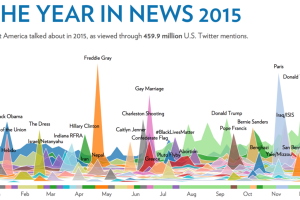
This visualization analyzes 459.9 million tweets over the course of the year to show the magnitude and timing of trending news stories in 2015. Read more

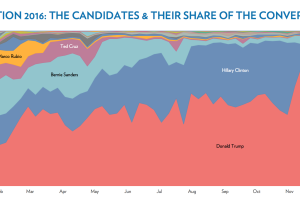
An in-depth analysis of over 2 billion tweets shows who and what dominated the news cycle of 2016 in the United States. Read more

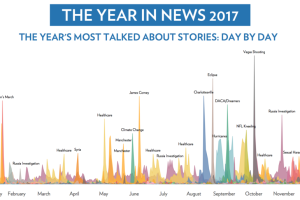
What were the most talked about news stories of 2017? This infographic crunches the data on 2.8 billion tweets to find out. Read more

