
These are the 100 biggest websites in the United States, broken down by type as well as the parent company that owns them. Read more
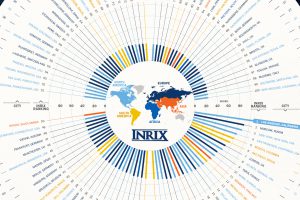
Which city has the ultimate distinction of having the world’s most horrific traffic? See this infographic to see the most congested cities globally. Read more
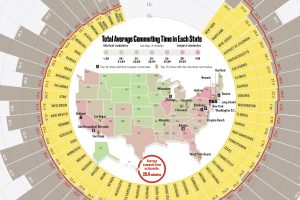
This infographic compares all U.S. states by average commute time, while also listing the top 10 cities with the longest and shortest commutes in the country. Read more

America’s major cities are some of the most traffic congested in the world. Click to find out which ones made the top 10. Read more

This graphic illustrates Panama Canal traffic by shipment category, looking at the total number of shipping crossings and the total tonnage. Read more
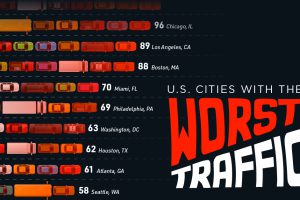
Congestion resulted in U.S. drivers losing an average of 42 hours to traffic jams in 2023, equal to about one work week. Read more

Traffic congestion costs drivers many hours of lost time every year. Which cities had the worst rush hour traffic in 2023? Read more


